
Data-driven decision-making is paramount to running an effective media strategy and a successful business. Performance metrics are metrics and KPIs to measure in order to determine success. There are countless metrics to choose from, but this guide will inform you on how to cut through the noise and select the ones that are most useful to you and your business. Picking the right metrics and KPIs is only half the battle – then you need to measure results and utilize them in analyses to improve performance. Brands that do this successfully will have a strong foundation in place for long-term success.
What are Performance Metrics?
Marketing performance metrics are quantifiable data points that track the effectiveness and efficiency of marketing activities and campaigns. They provide insights into how marketing efforts are contributing to business goals. Below are just a few of the buckets of metrics that marketers find useful to measure:
- Brand Awareness Metrics: Measure the reach and impact of brand messaging. Examples include brand mentions, social media engagement, website traffic, and reach.
- Lead Generation Metrics: Track the effectiveness of lead generation efforts. Examples include the number of leads generated, conversion rates, cost per lead, and lead quality.
- Sales Metrics: Measure the impact of marketing on sales revenue. Examples include conversion rates, revenue generated, customer acquisition cost (CAC), and return on ad spend (ROAS).
What’s the Difference Between Metrics and Key Performance Indicators?
Marketers tend to throw both of these terms around interchangeably, but they’re distinct terms.
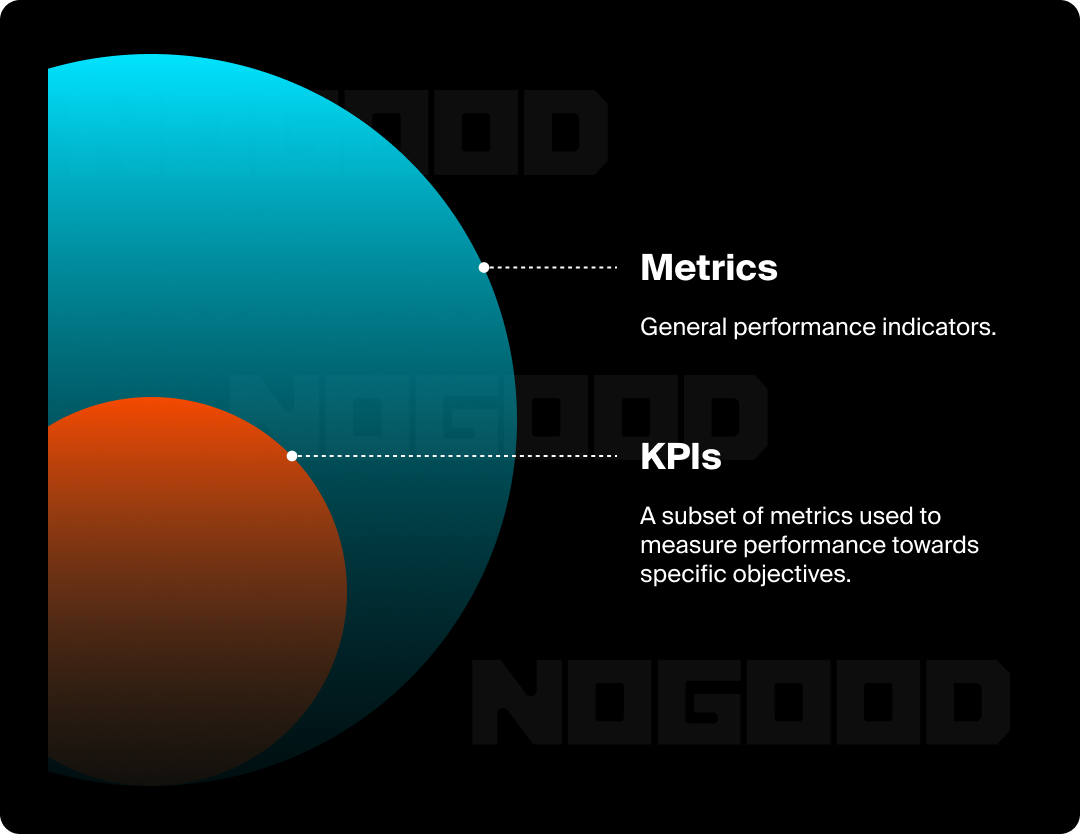
Performance metrics are any quantifiable measure used to track the performance of marketing activities, campaigns, or processes. They provide data and insights into various aspects of marketing efforts.
KPIs (key performance indicators) are a subset of performance metrics that are specifically chosen to reflect the most critical aspects of achieving strategic business goals. In other words, they’re hand-picked metrics that are most critical in determining success.
For example, it’s good to know the CTR of your paid media ads, but the success of your business cannot be quantified with such a metric. ROAS (return on ad spend) or CPI (cost per install) are metrics that are more important to the overall success of the business. CTR would be considered a performance metric and ROAS or CPI would be considered a KPI.
Measuring and Tracking Performance Metrics
Measuring and tracking performance metrics is crucial for understanding the effectiveness of your marketing efforts and making data-driven decisions. Here’s a step-by-step breakdown of the process:
1. Set Clear Goals
Set Crystal-Clear Goals: What are you trying to achieve with your marketing? Is it boosting brand awareness, generating a flood of leads, driving sales through the roof, or creating raving fans?
Setting Goals: Volume vs. Revenue
Segmenting metrics by goal provides a clear understanding of performance and facilitates targeted strategies. What do you want to achieve for your brand: volume of purchases or value of purchases? Once you can identify your goal, the metrics and KPIs you track will fall into place.
Oftentimes brands want to do a “both and” approach when it comes to these goals, but it’s important to pick one primary goal or north star so you can align your strategy with a central aim.
- Volume: This goal typically focuses on driving purchases, new customers, returning customers, or installs. More junior brands tend to prioritize volume so they can develop a significant customer/user pool and prove the viability of their product and service.
- Value: This goal typically focuses on metrics such as new customer revenue, returning customer revenue, and lifetime value. More experienced brands gravitate towards this goal because they have already developed their footing and want to move to the next level of growth. AOV and repeat purchase rate are key factors to consider with this goal, but not as relevant for volume.
2. Identify KPIs and Set SMART Targets
These are the key metrics that will act as your compass, guiding you towards your goals. Think of them as your North Star metrics that will help you determine if you’re hitting your goals or not. If your goal is to increase sales, your KPIs might include conversion rates, customer acquisition cost (CAC), and return on ad spend (ROAS).
Example Volume KPIs:
- Purchases: Number of successful transactions.
- New Customers: Number of first-time users acquired.
- Returning Customers: Number of repeat users.
- Installs (App/Software): Number of successful installations or downloads.
- Lead Volume: Number of leads generated.
Example Value KPIs:
- New Customer Revenue: Total revenue generated from new users.
- Returning Customer Revenue: Total revenue generated from repeat users.
- Return on Ad Spend (ROAS): Revenue generated per dollar spent on advertising.
- Customer Lifetime Value (CLTV): Total revenue projected to be generated from a user over the course of their relationship with the business.
- Installs: Total installs driven for an app.
- Cost per Install (CPI): Total spend to acquire an app install.
- Leads: Total number of leads generated in a period.
- Cost per Lead (CPL): Total spend to acquire a lead.
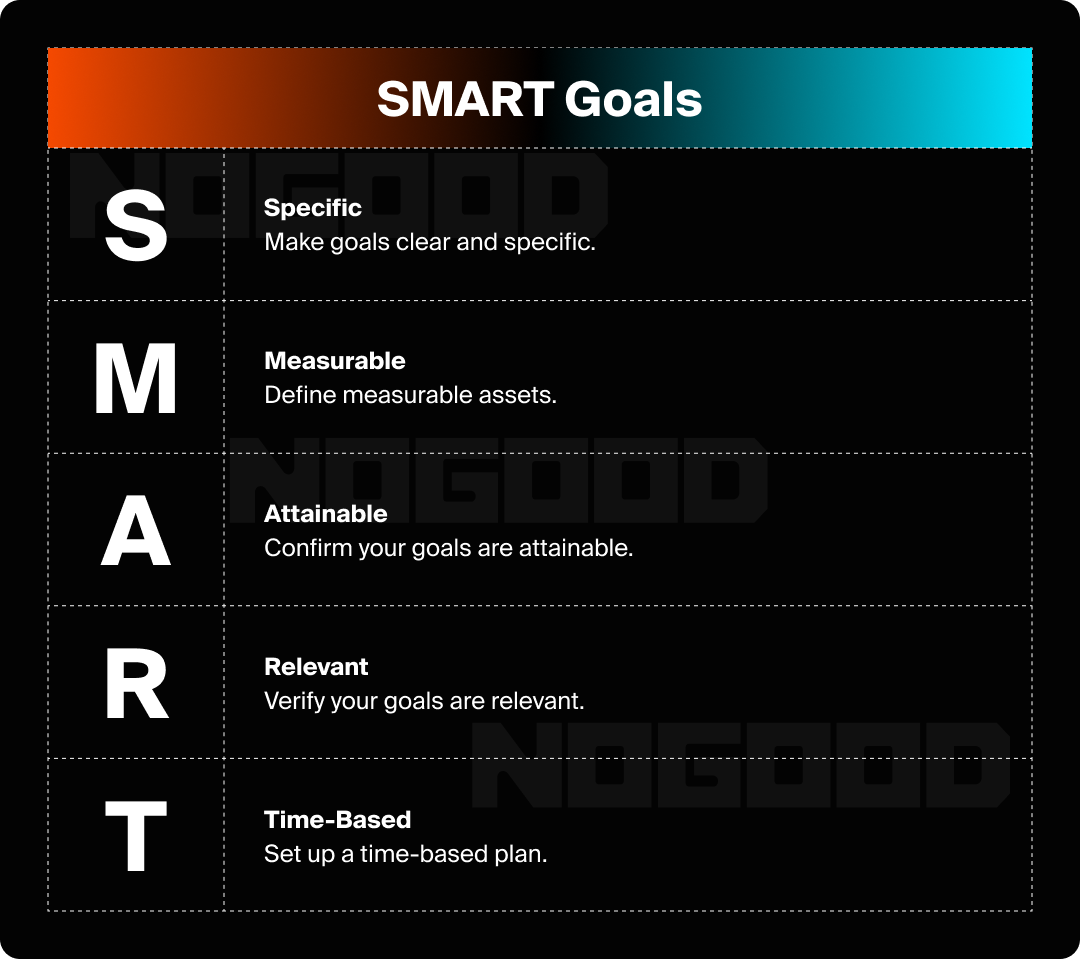
Once you’ve decided on your KPIs, the next step is to develop SMART Targets. Avoid stating something vague like “I want more sales.” Set specific, measurable, achievable, relevant, and time-bound targets for each KPI. For example, “Increase purchase volume by 15% YoY in Q4.” The idea is to set a SMART target that you can evaluate at the end of the quarter or evaluation period and directly answer ‘yes’ or ‘no’ to the question: did we achieve our goal? This is easier said than done, but with enough practice, it will become second nature.
3. Identify Your Performance Metrics
As we mentioned above, KPIs are crucial to understand if you’re successful in your marketing efforts or not. Performance metrics are meant to supplement data at your disposal and help you make decisions in the day-to-day when managing your campaigns. When it comes to performance metrics, it’s better to collect more data vs. less so you have it at your disposal when conducting analyses. You can always cull down your view of data to analyze, but you can’t add more data if the proper tools and tracking aren’t set up.
Below are examples of common ones that many brands track:
- Website
- Website Traffic: Tracks the number of visitors to your website. Provides insights into the reach and effectiveness of your marketing efforts in driving traffic. Analyze traffic sources to understand which channels are most effective.
- Average Order Value (AOV): Calculates the average revenue generated per transaction. Important for understanding customer behavior and identifying opportunities to increase revenue per sale.
- Conversion Rate (CVR): Measures the percentage of website visitors who complete a desired action, such as making a purchase or filling out a form. Crucial for assessing the effectiveness of your website and marketing campaigns in driving conversions.
- Bounce Rate: Measures the percentage of visitors who leave your website after viewing only one page. A high bounce rate can indicate that your website content is not relevant or engaging enough.
- App
- Install-to-Registration Rate: This metric, specific to app marketing, tracks the percentage of users who complete the registration process after installing the app. It helps assess the effectiveness of the onboarding process and identify areas for improvement.
- App Visits per Week: Measures how frequently users open and use the app within a week. This metric provides insights into user engagement and the stickiness of the app.
- Paid Media
- Click-Through Rate (CTR): Measures the percentage of people who click on a link or advertisement after seeing it. A key indicator of how effective your ads or links are at attracting attention and driving traffic.
- Cost Per Thousand Impressions (CPM) / Cost Per Click (CPC): Relate to advertising costs. CPM measures the cost of displaying your ad to 1,000 people, while CPC measures the cost you pay each time someone clicks on your ad. Helps evaluate the efficiency of your campaigns.
- Organic Media
- Social Media Engagement: Tracks how users interact with a brand’s social media content. Includes metrics such as likes, shares, comments, and mentions. Important for building brand awareness, driving traffic, and fostering relationships with customers.
- Social Media Followers: Measures the number of people who follow a brand’s social media accounts. While not always the most important metric, it can indicate brand reach and potential audience size.
4. Set up Analytics Tools
Now that you have established your goal, your KPIs, and additional performance metrics you want to analyze, you need the right tools to bring your vision to life. Thankfully, there are so many at our disposal. The challenge is figuring out the right combination of them to best serve your business needs. If you’re lucky to work with a marketing agency or even us at NoGood, you’ll be able to benefit from the relationships formed with these analytics partners.
Analytics Platforms
The right analytics platform will enable you and your team to track key metrics, identify what’s working and what’s not, understand customer behavior, optimize campaigns, improve efficiency, and enhance the customer experience. There are countless options, but these are some of the more common solutions that can help you get started right away.
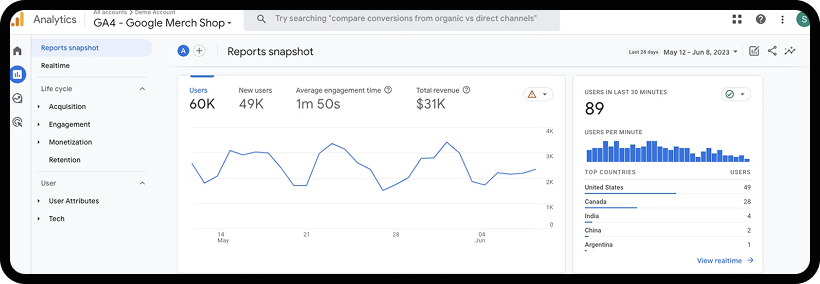
1. Google Analytics
- Main features
- Track website traffic, user behavior, and conversions.
- Analyze audience demographics, interests, and traffic sources.
- Monitor content performance and measure marketing campaign effectiveness.
- Benefit: Free and widely used, offering a comprehensive set of features for website analysis.
- Drawback: Can be complex and overwhelming for beginners, with a steep learning curve for advanced features.
2. Adobe Analytics
- Main features
- Enterprise-grade platform for large businesses with complex data needs.
- Combines data from various sources for a holistic view of customer journeys.
- Offers advanced segmentation, predictive analytics, and customizable reports.
- Benefit: Robust and powerful, offering advanced analytics and customization for enterprise-level businesses.
- Drawback: Expensive and requires technical expertise to fully utilize its capabilities.
3. HubSpot Marketing Hub
- Main features
- All-in-one platform with analytics, email marketing, social media management, and CRM.
- Track leads, analyze behavior, and automate marketing workflows.
- Measure campaign performance and understand attribution.
- Benefit: All-in-one platform that integrates various marketing tools with analytics for a streamlined workflow.
- Drawback: Can be costly, especially for smaller businesses with limited budgets.
4. Custom Looker Dashboard
- Main features
- Create a wide range of visualizations, from basic charts and graphs to interactive maps and complex heatmaps, to represent your data in the most insightful way.
- Go beyond pre-built dashboards and explore your data with Looker’s powerful querying and drill-down capabilities, uncovering hidden patterns and insights.
- Connect to various marketing data sources, including Google Analytics, CRM systems, social media platforms, and marketing automation tools, for a unified view of your marketing performance.
- Benefit: Customize every aspect of your dashboards, from data sources and visualizations to filters and drill-downs, to create a truly bespoke analytics solution.
- Drawback: Building and maintaining custom Looker dashboards requires technical expertise and knowledge of data modeling, which may necessitate dedicated resources or training.
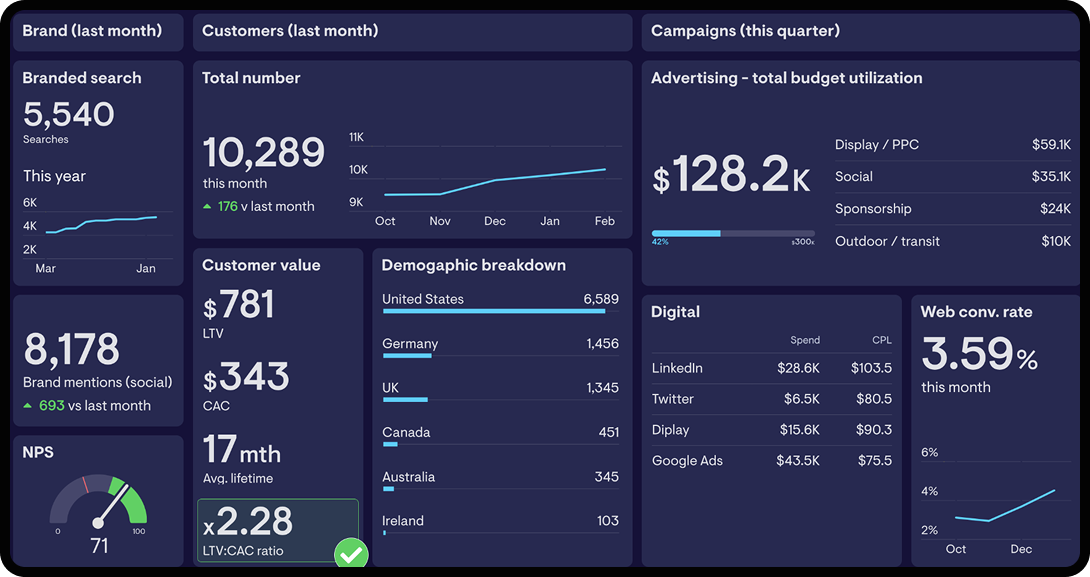
Each of the different tools has different visualization capabilities, but it’s important to set up charts and graphs that help you easily understand performance in real time and at a glance. You don’t want to be bogged down with data that’s not easily understood or actionable. It’s a good idea to create reports that are tailored to different stakeholders.
For example, the CMO will likely want an executive dashboard that focuses on the bird’s eye view of performance, but your Paid Social Manager will need more detailed data to make informed decisions. Consult with various stakeholders and your agency to ensure everything necessary is included in your analytics dashboard so you’re set up for success.
5. Implement Tracking
Once you’ve decided on the analytics platform that’s the best for your business, it’s time to set up your tracking systems:
- Website Tracking: Install tracking codes (like the Google Analytics snippet) on your website to capture every click, scroll, and conversion.
- Campaign Tracking: Use UTM parameters to tag your links and see exactly which campaigns and channels are driving the best results.
- Social Media Tracking: Monitor your brand mentions, engagement levels, and follower growth with the built-in analytics tools on each platform.
If you notice you aren’t seeing data come in from certain campaigns because of a tracking error, consider turning off your campaigns for the time being while you solve the technical issue. You likely don’t want to spend on ads if you’re unable to analyze the performance metrics associated with them.
Using Metrics to Improve Performance
Now you’re measuring and tracking performance metrics. Data is officially flowing in, and now it’s time to make sense of it all with deep insights and actionable next steps.
Dive deep into the data and try to zoom out enough to understand overall trends and patterns. It’s often helpful to start with analyzing performance metrics period over period (PoP) and seeing which ones are driving the most significant variance.
These steps are very helpful if you’re not sure where to start:
- Identify: Pinpoint areas of underperformance based on metric analysis for each goal.
- Investigate: Determine the root causes of underperformance for acquisition and revenue.
- Hypothesize: Develop hypotheses for potential solutions for each goal.
- Test: Implement and test solutions using A/B testing or other methods, for both acquisition and revenue.
- Implement: Roll out successful solutions across the agency.
Here’s an example of how this would come to life. Imagine your brand is a language learning app and downloads are down in Q3 of this year vs. Q3 last year.
- Identify: Auction costs (CPMs) have gone up drastically despite overall budget remaining the same.
- Investigate: CPMs are elevated on Meta but not on Snapchat or Reddit. You remember that you adjusted your age targeting last year in Q3 to target younger users because your team said they had higher retention.
- Hypothesize: Perhaps CPMs are up because of your audience size on your biggest platform. Now you’re in more intense competition with other brands, trying to grab the attention of young users.
- Test: You try expanding to another Social platform such as Pinterest because you know you can reach your target audience there, and there’s not too much overlap between users on that platform and the others you’re currently on. You will ideally reach new users at a lower CPM, diversifying your platforms at the same time.
- Analyze and Repeat: You analyze the results and see that your CPMs improved a bit, but there are still gains you need to make to get back to where you were last year. You investigate further and try new tests such as launching on a different platform or trying a new campaign type on Meta powered by machine learning. Share your discoveries and insights with the broader team so you can get more ideas on what to test next.
You’ve reached the end of this guide. Hopefully, by now you should know more about performance metrics and how to utilize them to drive success for your brand. As we mentioned, starting with goals is crucial because your KPIs will directly tie to what you want to achieve. Performance metrics are secondary to your KPIs but are good for you to be aware of so you can investigate performance and develop strong next steps.
Use this guide to plan your next 90 days and begin measuring performance metrics for your marketing campaigns:
- 15 Days: Decide what your goal is.
- 30 Days: Establish KPIs and performance metrics.
- 60 Days: Onboard to an analytics platform and begin tracking.
- 90 Days: Analyze performance and iterate to improve performance.
Good luck on your performance marketing journey and utilizing performance metrics to hit your goals. We’re happy to be a resource and support you as you learn more and develop your marketing strategy.