
It should come as no surprise that the modern marketer needs to master one major skill; data. As growth marketers, a huge part of our job is gathering data, reporting on the data we’ve gathered, and crunching the numbers to make a keen analysis. The era of gut-feeling marketing is over. The only way to get ahead is through skillful data analysis and application.
But in order to become a data master, it’s important to know which common mistakes to avoid. We’re here to help, with 13 deadly data analysis mistakes many marketers make – but you don’t have to!
1.Vague Objectives
Setting up your campaigns without a clear objective will result in poorly collected data, vague outcomes and a scattered, useless analysis. Don’t dig into your data with a general question like, “how’s my website doing”?
Instead, start your campaigns with a clear hypothesis to test. Ask yourself specific questions to clarify your intentions. Determine your Northern Star metric and define your parameters, like the times and locations you’ll test. For example, asking “How many page views did I get on Saturday from users in London?” gives you a clear metric to compare.
2.Sampling Bias
Sampling bias is when you draw conclusions from a set of data that are not representative of the population you’re trying to understand.
For example, you might run a test campaign on Facebook or LinkedIn, and then assume your whole audience is a certain age group based on the traffic you draw from that test. But, if you were to run the same campaign on Snapchat, your traffic would skew younger. In this scenario, the age range of your audience is contingent upon the channel used to deliver the message – not necessarily indicative of your audience as a whole.
When running your campaigns and coming to conclusions, always be wary of platform or dataset biases, which may influence your outcomes in a certain direction.
3.Unequal Comparison
One way to combat sampling bias is to compare multiple datasets. However, when comparing two or more sets of data, make sure to avoid unequal comparison.
Unequal comparison is when two data sets of unequal weight are compared to each other. A common example of this is comparing two reports from two different time periods. They may both be a month over month, but if they fail to acknowledge seasonality or the weekend effect, then they’re likely unequal. For example, site traffic for an eCommerce site during the month of December is likely influenced by the holiday season, and therefore shouldn’t be directly compared to traffic numbers from the month of March.
When comparing two or more data sets, always make sure they carry equal weight, and standardized as much as possible before drawing conclusions.
4.Understanding the Meaning of a Metric
Let’s be honest, marketers use a lot of jargon. Even if you’ve been in the game for a while, metrics can be oddly labeled or have different meanings in different contexts. It’s easy to assume you understand the data when you really don’t.
Bounce rate is a good example of this. When we recently asked a group of marketers, they all agreed that bounce rate was just visitors leaving the site too quickly.
This is actually false – bounce rate is the percentage of visitors who navigate away from a site after viewing only one page. And that means a high bounce rate isn’t always a bad thing. For example, you can expect your bounce rate to be high on a site with just a few pages. And a single page site will get 100% bounce rate.
Taking the time to make sure you understand the meaning of each metric within your specific context will save you confusion and ensure your data analysis is solid.
5.False Causality
This is an easy one to fall for because different marketing strategies can affect each other.
Let’s say you’ve launched a Facebook campaign, and then you notice a sharp uptick in organic traffic. You might naturally conclude that your Facebook campaign drove traffic to your sight.
This conclusion may not be true and automatically assuming one action directly caused another will quickly get you into hot water. Sure, the two phenomena might be correlated. But another campaign might actually be responsible for the traffic increase, or seasonality, or any of a variety of variables.
The point is, don’t assume that because two events appear related, one directly caused the other. Keep the two separate while conducting your analysis, and test any apparent correlations. Remember the golden rule; correlation DOES NOT equal causation.
6.Losing Sight of your Northern Star
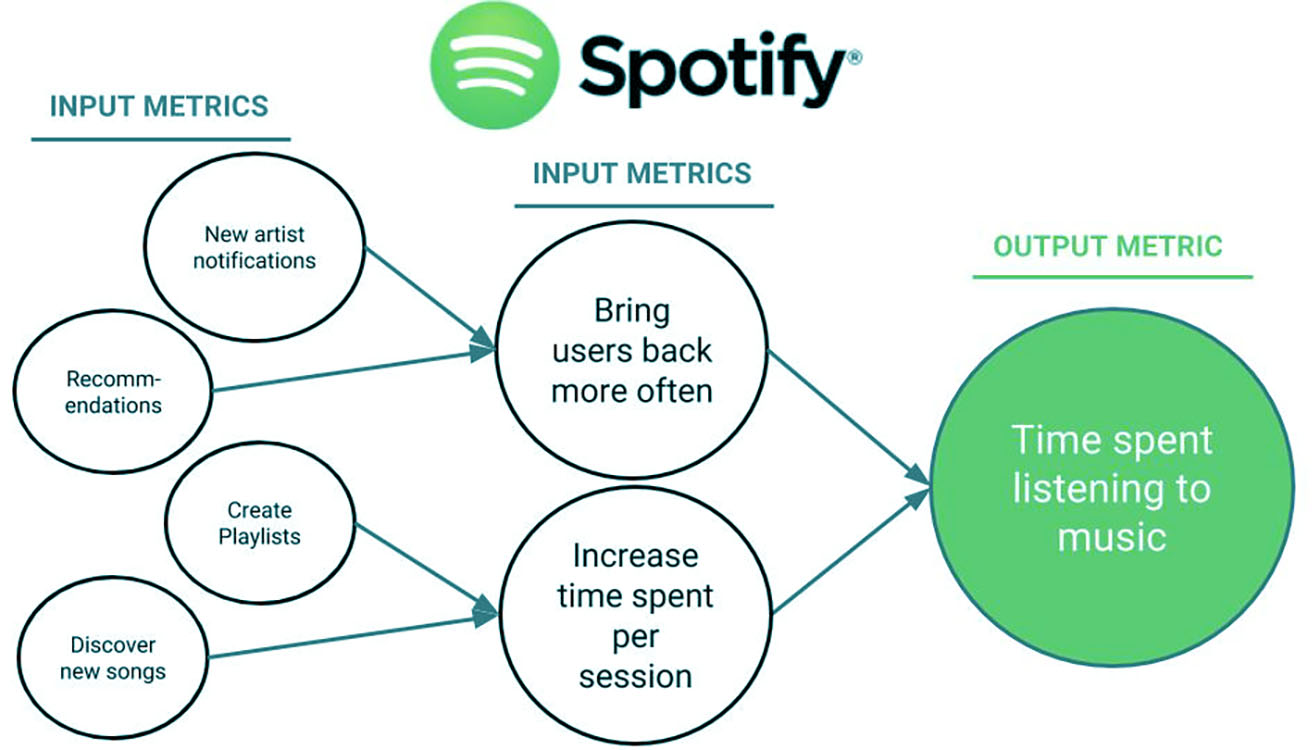
Just as old-school sailors looked to the Northern Star to guide them home, your Northern Star Metric should be the “one metric that matters” for your growth. That means the one metric that accurately measures the success you’re aiming for. Any other metrics you’re keeping track of should tie back to your northern star.
So be careful not to get bogged down in a sea of useless vanity metrics, that don’t actually contribute to your primary growth goal. It’s easy to get distracted, especially when using multiple platforms and channels. Stick to your key metric, and only focus on the indicators that directly influence it.
7.Data Dredging
Let’s say you’ve got a great data set, and you’ve successfully tested your hypothesis. It might be tempting, but don’t make the mistake of testing multiple new hypotheses against the same set of data.
While this may seem like an easy way to get the most out of your work, Any new correlations you make will likely be the result of chance, because you’re primed by your first result to see connections that aren’t actually there. These coincidental correlations are not meaningful indicators.
A good way to avoid this mistake is to approach each data set with a clear, fresh hypothesis or objective. And, when the hypothesis changes, refresh your analysis with a new set of data.
8. Getting Tunnel Vision
As growth marketers, we’re always looking for data validation. Numbers give us confidence – they’re objective. They give us some quantitative truth. But focusing too much on raw numbers can also be misleading. It’s like not seeing the forest through the trees. Marketers who focus too much on a metric without stepping back can lose sight of the bigger picture.
It’s good if your organic traffic is up, but are your visitors actually making purchases? Your social media presence is growing, but are more people becoming engaged, or is it still just a core group of power users? In order to get the full story, it’s important to step back and look at your key metrics within the context of the larger story.
9. Lack of Statistical Significance
You’ve run a test, you’ve gathered your data, and you have a clear winner. But make sure not to draw your conclusions too early without real statistical significance.
This mistake is common when running conversion A/B tests, where the outcomes might seem obvious at first, with one test outperforming another. But it’s important not to rush to a conclusion too early.
Make sure you have high probability and true statistical significance in order to identify the winning variation. For example, when executing A/B tests, we recommend a 96% probability and a minimum of 50 conversions per variant to determine a clear outcome.
10. Relying on the Summary
Marketers are busy, and it’s tempting to just give your data a quick skim and then make a determination. Most platforms enable this kind of thinking by providing summary metrics, which are essentially averages of your overall metrics.
But making decisions based on summary metrics is a mistake because data sets with similar averages can contain huge variances. Your Google Ad might get about 2,000 clicks per week for four weeks straight, but that doesn’t mean those weeks are comparable, or that customer behavior was the same. In order to determine the true response to your Google Ad, you’ll need to look at the full data sets for each week to get an accurate picture of audience behavior and engagement.
Don’t fall prey to relying on summary metrics, and always consult your raw data before making any actionable conclusions.
11. Not Differentiating Between Mobile and Desktop
As more users gravitate to mobile, cross-platform marketing has become essential. But, it can present major challenges.
Mobile and desktop require unique campaigns, and therefore equally different approaches to analytics. Don’t make the mistake of just combining your data sets into one pool and analyzing the data set as a whole.
Users behave differently on traditional computers versus mobile devices, and their data should be kept separate in order to conduct a proper analysis. In this way, you’ll be able to gather insights you’d otherwise miss, and have a more accurate picture of true customer behavior.
12.Focusing on (or Ignoring) Outliers
Although Malcolm Gladwell might disagree, outliers should only be considered as one factor of an analysis; they should not be treated as strong indicators on their own. This is because web data is complex, and outliers will naturally occur in the process of mining information.
The natural reaction is to totally ignore an outlier as a fluke or to pay too much attention to an outlier as a meaningful sign. As with most things, the truth usually lies somewhere in the middle.
For example, excusing an unusual drop in traffic as a seasonal effect might cause you to miss a larger issue. Or on the opposite side, creating an entire campaign around an unusual spike in traffic might lead you down a completely incorrect path. Always consider your outliers within the broader context of your analysis, and be sure to thoroughly prove your assumptions before acting on them.
13. Overfitting
Overfitting is a term used in statistics to describe a mathematical model that exactly fits a given set of data. It describes an model that does a good job of explaining the current set of data on hand but which struggles to predict future patterns. It’s too closely tied to exact numbers without focusing on the overall pattern of the data.
Marketers fall prey to this thought process all the time. When looking at your data, be sure to consider the broader, overarching patterns of behavior your data uncovers, rather than trying to justify every variation. Keep your models simple, and flexible
14. Cherry Picking
It’s human nature to be especially receptive to data that proves your assumption; you thought your Facebook campaign would drive traffic, and then traffic increased after you launched the campaign. But in this case (and so many others) you’re just focusing on the one metric that proved your assumption. Once you consider all the other channels driving traffic to your site, you might notice the Facebook campaign had very little effect on your traffic numbers overall.
This is cherry picking, and it’s easy to do accidentally, or worse, intentionally. It’s important to view your data through a broader lens and consider multiple metrics when drawing conclusions to avoid relying too heavily on one specific indicator.
15. Lacking Actionable Conclusions
You formed a specific, testable hypothesis. You gathered data from multiple sources, determined the key metrics that tie back to your Northern Star, and compared your hypothesis to the numbers. Your outcomes are statistically significant. Now what?
Too many times, marketers conclude their analysis with statements that don’t provide an opportunity for action. Look at the outcomes of your test, and apply them to your overall objectives. What worked? What didn’t work? How will you incorporate these learnings to drive your Northern Star metric? Master Growth Marketers always walk away from their data analysis with clear, actionable insights.
Conclusion
These are the 15 deadly data mistakes marketers should avoid in order to become expert growth marketers. While some of these may seem obvious, when you’re in the data trenches it’s easy to get caught up in your metrics without pausing to evaluate your own analytic process.
Keeping these common mistakes in mind will help you avoid the pitfalls of so many marketers before. And when your data-driven campaigns are more reliable, you’ll be rewarded with the growth you’re seeking.