
SEO reporting is an essential tool to inform your SEO strategy. A solid SEO report shows clients, stakeholders, and bosses the results of your SEO efforts. It also provides an opportunity for your team to sync on your strategy and plan content to ensure you are aligned and on track to meet your goals.
In this article, we’ll discuss the best practices for creating SEO reports and show you how to build one from scratch. We’ll also show you some tools and templates to get you started.
Here’s what we’ll cover:
- What is an SEO report?
- Best Practices for Building SEO Reports
- How to Build an SEO Report
- Tools to Create SEO Reports
- SEO Reporting Is Essential to a Comprehensive Growth Marketing Strategy
Ready? Let’s get started.
What is an SEO Report?
SEO reporting is a crucial tool for informing and enhancing your SEO strategy. It offers invaluable insights into your website’s performance, highlighting areas for improvement. Analyzing user behavior and website data lets you monitor your website’s performance and health. An SEO report consolidates this data, providing actionable insights for optimizing and improving your website.

Best Practices for Building SEO Reports
SEO reporting relies on precise, organized data and actionable insights for improving website performance and traffic. Here are some best practices for creating SEO reports.
Organize your data with period-over-period comparisons
Period-over-period comparisons help you compare your website’s performance with previous weeks, months, or years to show how the site changed over time.
By organizing your data in time comparisons, you can measure your performance and determine how your website has grown and improved.
If there are changes made to your website that had a negative result, that will be clear when the data is compared to previous quarters.
Define Clear Objectives Supported by Data
The data in your SEO report should be backed by clear, defined growth goals. Create objectives to work towards, then provide the data showing the results of your work.
Provide Context for Your Data
A solid SEO report will explain what the data means, rather than just cramming a bunch of numbers and graphs on the page.
Provide the numbers, but go a step further and explain what factors contributed to the data and how it can change in the future. Give your team examples of what the data represents and how you can use it to improve your SEO and content strategies.
Segment Data by Specific Factors:
Segmenting data by factors like keywords, location, and user demographics can help to reveal valuable patterns and trends in the data. This provides a deeper understanding of how users interact with your site.
Creating specific groups for your data allows you to identify which keywords drive the most traffic, which locations perform well, and which user demographics engage with your site the most.
Interpret the Data and Provide Actionable Insights for Improvements
After you pull and organize your data, draw insights and determine how your team can use this information to make valuable changes to your SEO strategy.
How to Build an SEO Report
Your SEO report will provide your bosses and clients with measurable results of your SEO efforts and give the team insights into improving your SEO growth strategy.
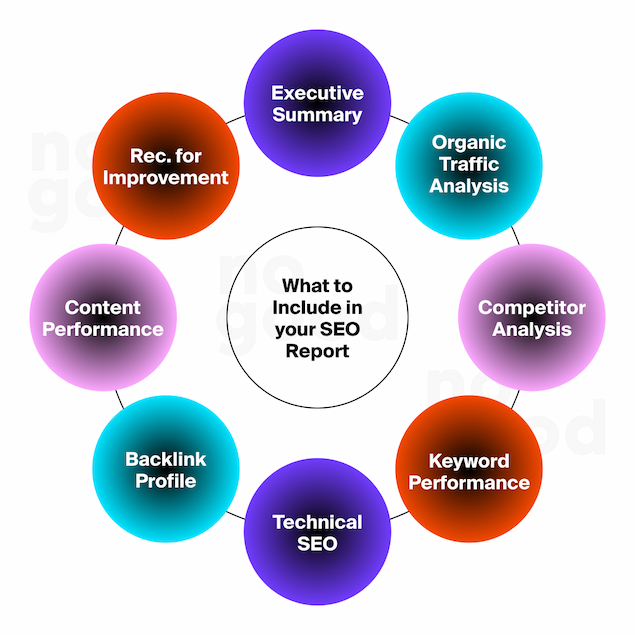
Executive Summary
The executive summary is basically a TL:DR of your SEO report.
It should give your client or boss a quick overview of your report’s most important findings and the actions needed to improve them.
Like all sections of your report, this section should be formatted as concise bullet points with key takeaways so busy clients and bosses do not need to read the entire report.
Organic Traffic Analysis
Organic traffic is a key indicator of how your website pages perform.
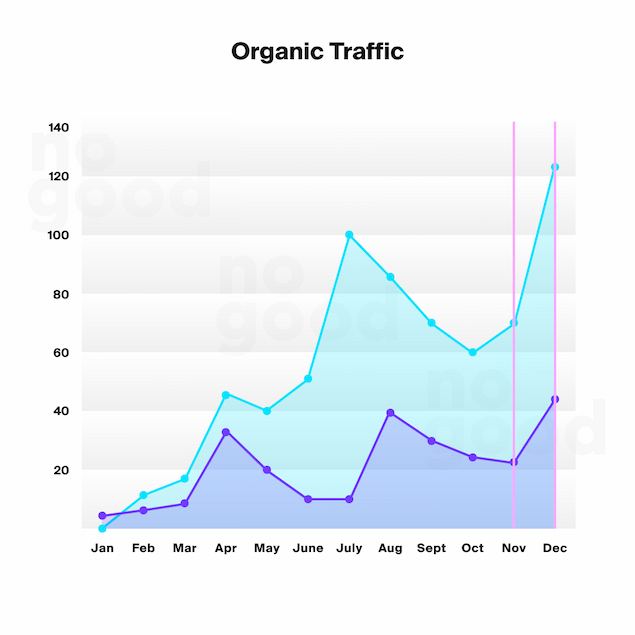
Often, the best way to present this data is with a graph or period-over-period comparison chart.
This data can give your team insights into how your content and website optimizations are performing.
Organic traffic data can be segmented into comparisons based on user demographics, top keywords, impressions, and clicks.
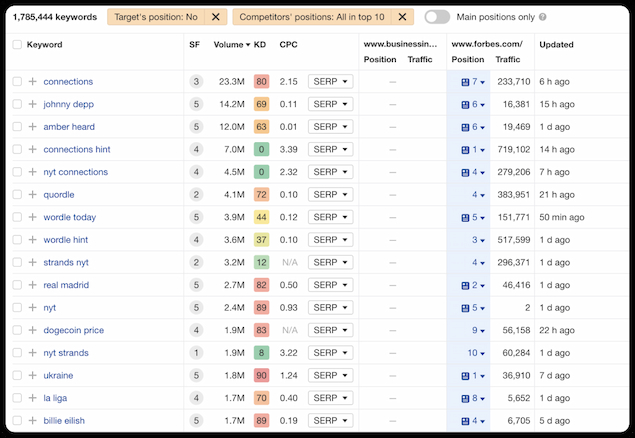
Keyword Performance
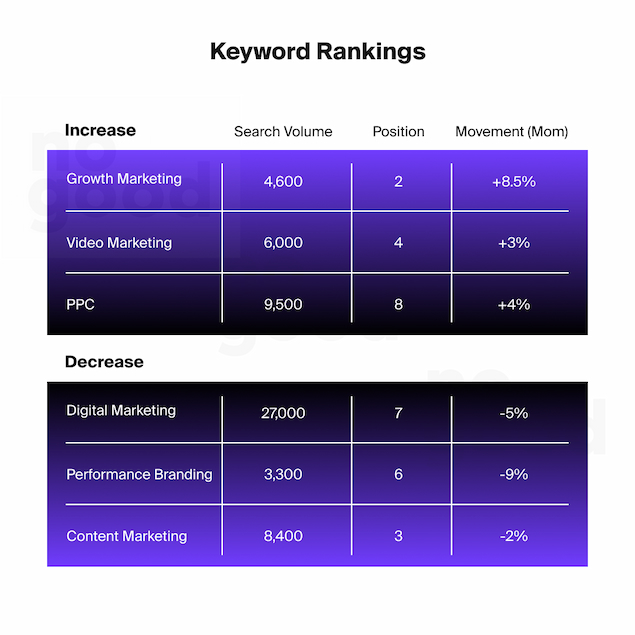
Keyword rankings are key indicators of how your content is performing. Collecting data on keyword performance, trends, and competitor keywords can determine which keywords you should target in your content.
You can collect data on your top-performing keywords and keywords that have lost traffic to see where you are doing well and where you need to optimize. You will also want to add the search volume for each keyword, your position for the article ranking, and the percentage of organic traffic that the article gained or lost over the period.
Competitor Analysis
Competitor analysis helps you leverage keyword research and optimization to get a leg up on your competitors in SERPs.
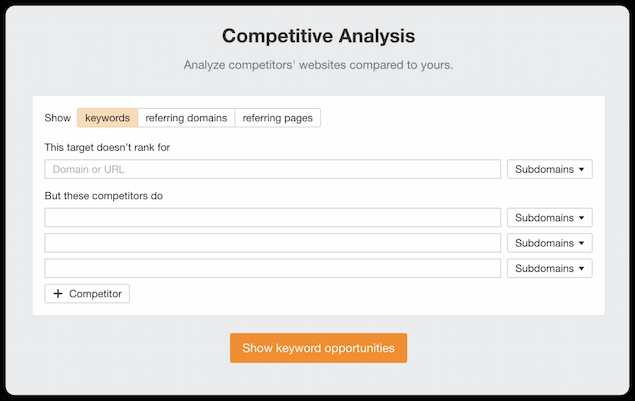
This data can inform your team of new blog topics and optimization opportunities to help you outrank your competitors.
You can uncover the keywords your competitors currently rank for so you can create content to compete with them in SERPS.
In your competitive analysis tool, you can filter by keyword difficulty to find low-hanging fruit keywords that are easy to rank for. This helps you uncover new keywords and topics to target in your blog content.
The competition analysis section of your report should also include a map or chart of where your website stacks up against your competitors.
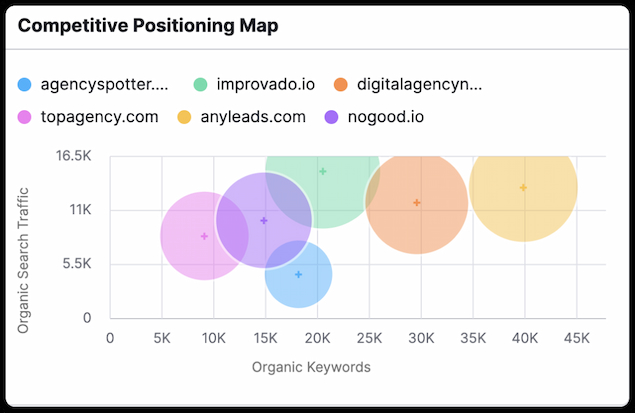
You can choose your top 5 competitors and compare their traffic and organic keywords against your own to see how you compare. This will give the team insights into how your strategy is performing.
Technical SEO
The technical SEO section of your report will reveal issues like broken links, slow page speed, redirects, and more. The best way to report on these issues is to run a site audit.
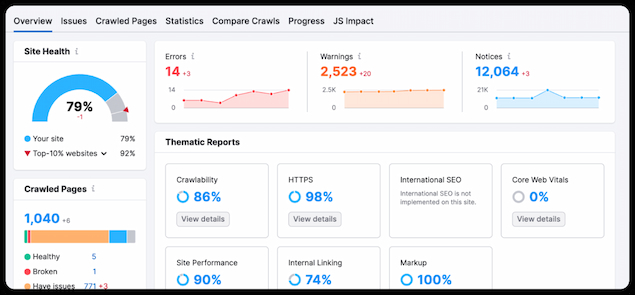
Site audits often find a host of problems, so it’s important to focus on the most critical issues first. Consider the warnings and error messages that are most important to your business and determine their effect on your overall site health.
You can use platforms like SEMrush and Ahrefs to run a site audit to uncover technical SEO issues on your website. Then, you can export the data into Google Suite to create your reports.
It can be easy to get caught up in the technical details of your site audit, but you should keep the data simple for your report.
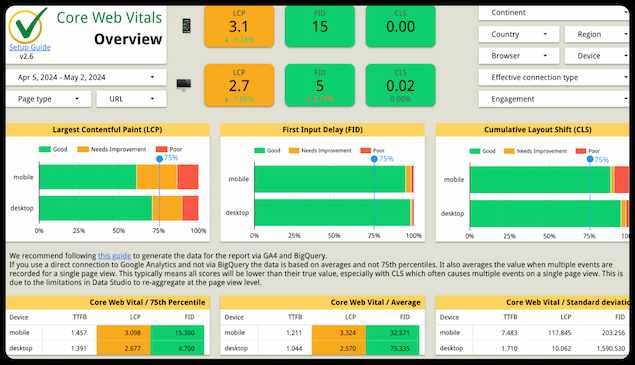
You should also report on your site health, which you can check in Google Search Console under Core Web Vitals.
Backlink Profile
Backlinks play a significant role in your website’s domain rating and authority.
Your report should include the number of links your website gained during the time frame and the website’s domain rating for each backlink.
Since Backlinks help you build authority, this data will illustrate your progress in building your backlink profile and increasing your domain rating.
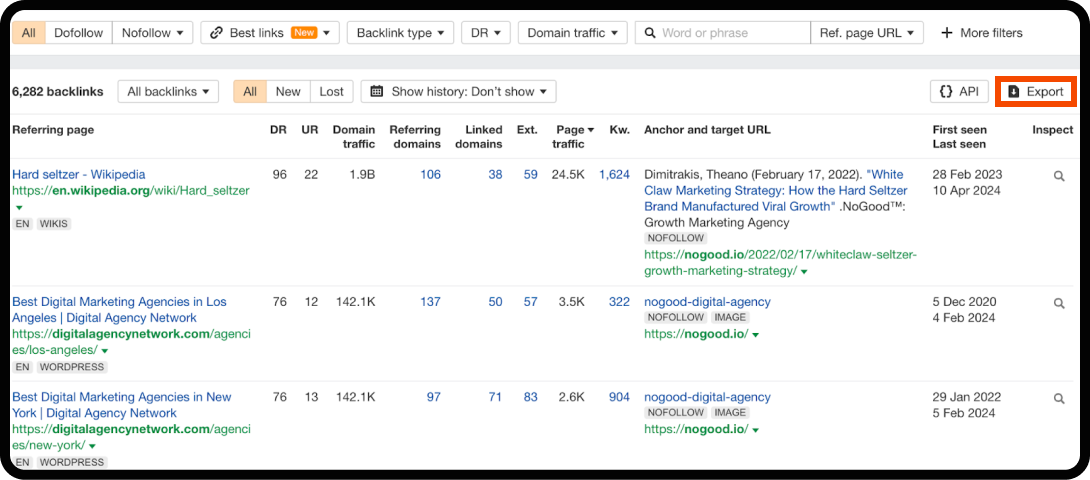
You can use a tool like Ahrefs to monitor your backlink profile, and toggle for filters like DoFollow links, best links only, types of backlinks, etc.
Once you have adjusted the filters, you can export backlinks to Google Sheets and Looker Studio to organize your numbers in tables and graphs.
Content Performance
As you add more content to your website, you’ll want to periodically monitor the performance of your new pages so you can update and improve. This data also helps inform your content strategy by illustrating which content types and categories are performing well.
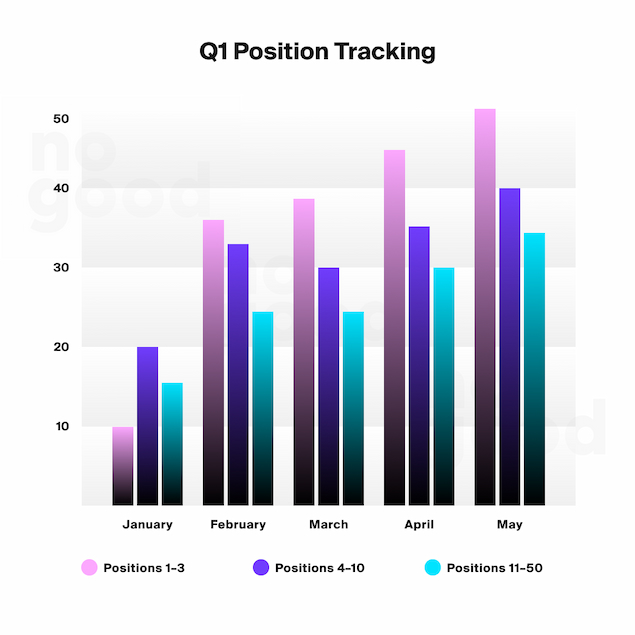
You’ll want to include position tracking data, which shows how much of your content is ranking high in SERPs. You can display this information in a chart or a bar graph.
For the content performance section of your report you should include the following:
- Top-performing pages with the number of clicks and impressions for each
- Pages declining in organic traffic and impressions for each
- Recommendations for improvement in content creation and strategy
Recommendations for Improvement
The final section of your report will decode the data from each section and recommend steps and actions to improve and grow your website.
This is the part of your report you will use to plan strategy and optimization opportunities for your website. It’s a chance for you and your team to collaborate and use the data and insights to brainstorm ways to improve your website and business as a whole.
Now, you can delegate tasks to your team members and determine the game plan for the next period.
Tools to Create SEO Reports
Looker Studio
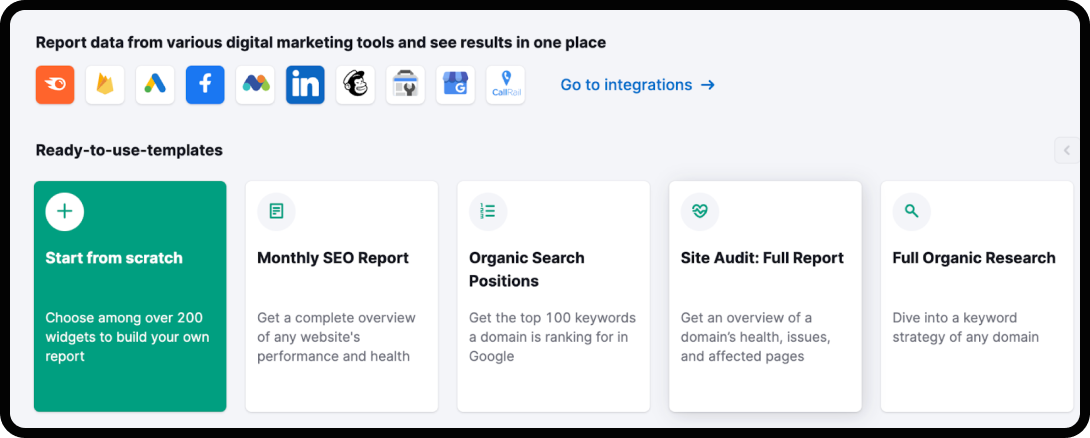
Google’s Looker Studio (formerly Google Data Studio) provides beautifully designed templates for visualizing SEO and website data.
You can create your own custom report or use one of Looker Studio’s templates to create stunning visual reports for your data.
Looker Studio structures SEO report templates in an organized, easy-to-visualize format. The SEO report templates can help you communicate your findings effectively, which is especially important when dealing with complex or large data sets. This can help your audience easily understand and draw insights from the data, which can help inform important decisions.
SEMRush SEO Report Templates
SEMRush offers report templates specifically tailored for your website data.
The data can be pulled straight from your SEMrush account and compiled into a simple report to help inform your SEO strategy.
You can integrate other platforms to seamlessly share data and add it to your reports. SEMrush makes it easy to create concise, easy-to-follow reports by automatically pulling and compiling your data, eliminating the need to create reports manually.
Google Analytics
GA4 is a powerful analytics tool that provides detailed insights into your website’s performance. It quantifies important metrics such as page views, bounce rates, and conversion rates.
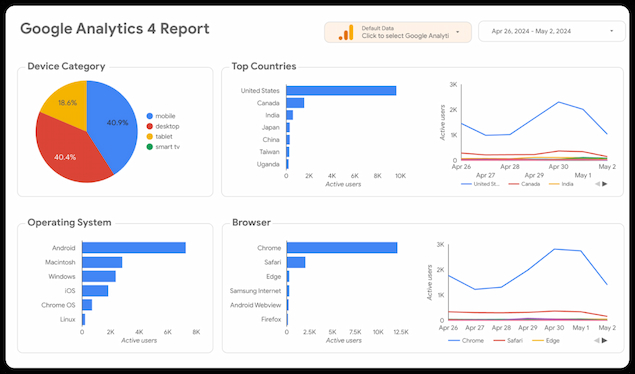
By analyzing this data, you can better understand how users interact with your site and identify areas for improvement. GA4 also tracks user behavior across multiple devices and platforms, giving you a more complete picture of your audience.
You can import your GA4 data into Looker Studio to create beautiful reports on your analytics. GA4 helps segment your data to put more context behind your numbers.
Google Search Console
Search Console provides insights into search performance metrics like CTR, organic traffic, average position, and impressions.
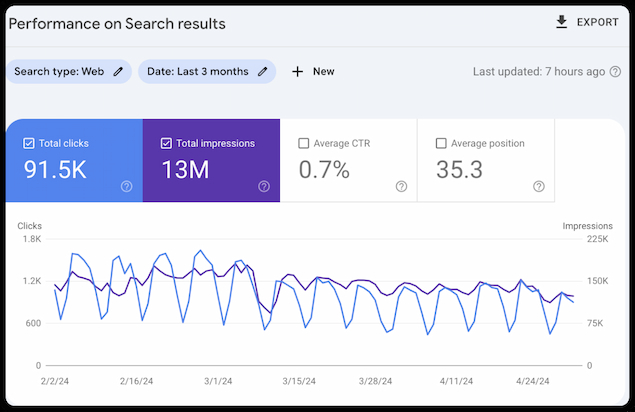
GSC can help you gain a better understanding of how your website is performing in search results and identify areas for improvement. These insights can help inform your SEO strategy and drive more traffic to your site.
Much like GA4, you can import data from GSC to Looker Studio to create visual reports of your website data.
SEO Reporting Is Essential to a Comprehensive Growth Marketing Strategy
SEO reporting helps your team visualize data and user interactions with your website and allows your team to figure out what’s working and improve what isn’t. This is a chance for your team to collaborate and draw insights from your website performance data. You can brainstorm, strategize, and plan the next steps to continually improve quarter over quarter and year over year. A solid SEO report informs your growth marketing and SEO strategy.