
Analyzing user behavior is a critical aspect of understanding how people interact with a product or service. By studying users’ actions, preferences, and reactions, companies can gain valuable insights to improve their offerings and optimize the overall user experience. This data-driven approach enables companies to make informed decisions, increase customer satisfaction, and stay competitive in today’s dynamic markets.
Importance for Product Teams
Analyzing user behavior is critical for product teams because it gives them a deeper understanding of how customers interact with their products. By tracking user actions, such as feature usage, navigation patterns, and session lengths, product teams can identify pain points and areas for improvement. This knowledge helps them prioritize product improvements and new feature development based on actual user needs and preferences, resulting in a user-centric and successful product.
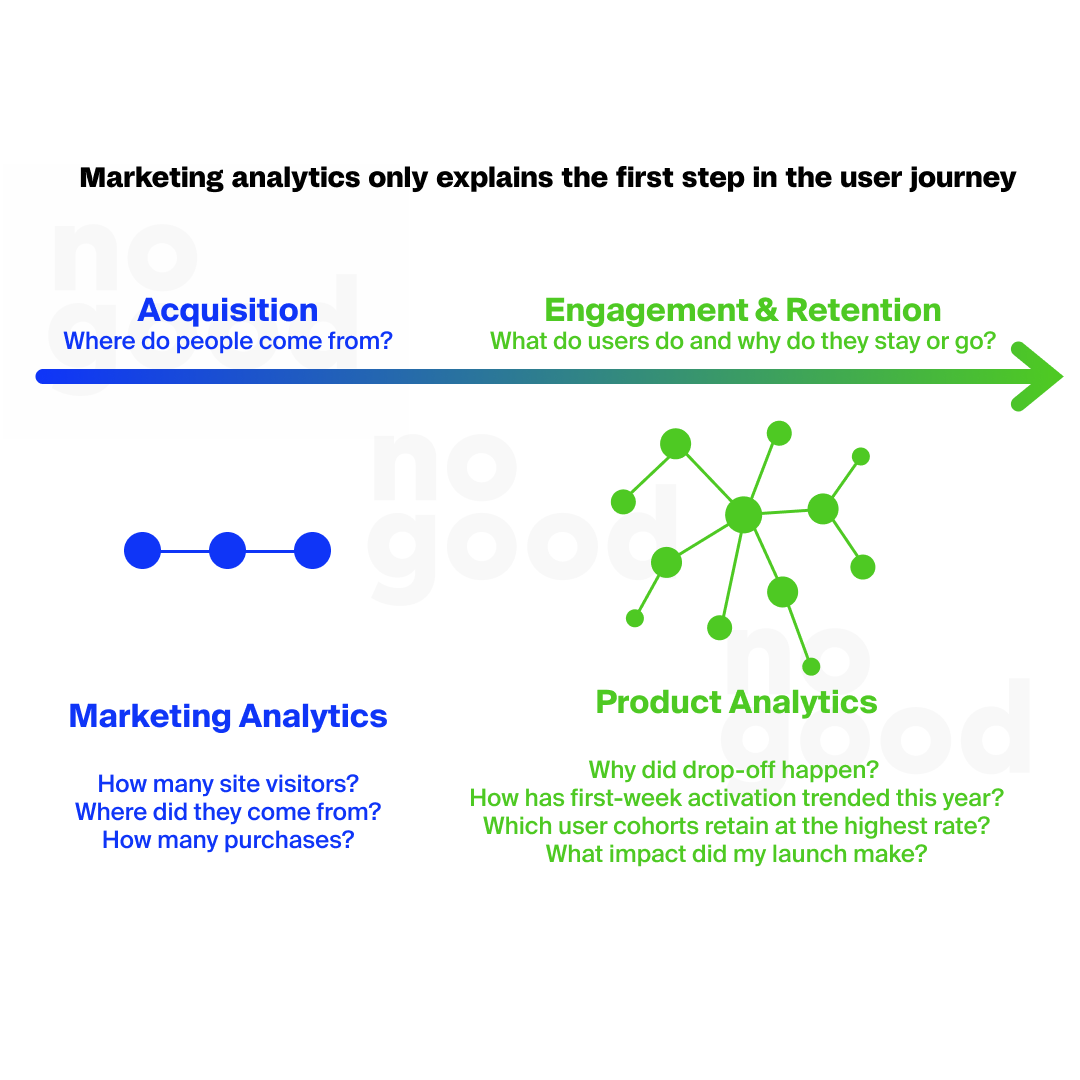
Importance for Marketing Teams
For marketing teams, analyzing user behavior is a treasure trove of valuable insights. Understanding user behavior can help marketers identify the most effective channels for reaching their target audience and tailor their messages to resonate with potential customers.
By analyzing user interactions with marketing campaigns, landing pages and ads, marketers can optimize their strategies, increase conversion rates and maximize return on investment (ROI). It also enables them to create personalized experiences that drive long-term customer loyalty and engagement.
Key Metrics for User Behavior Analysis:
Several key metrics play a vital role in user behavior analysis. These include:
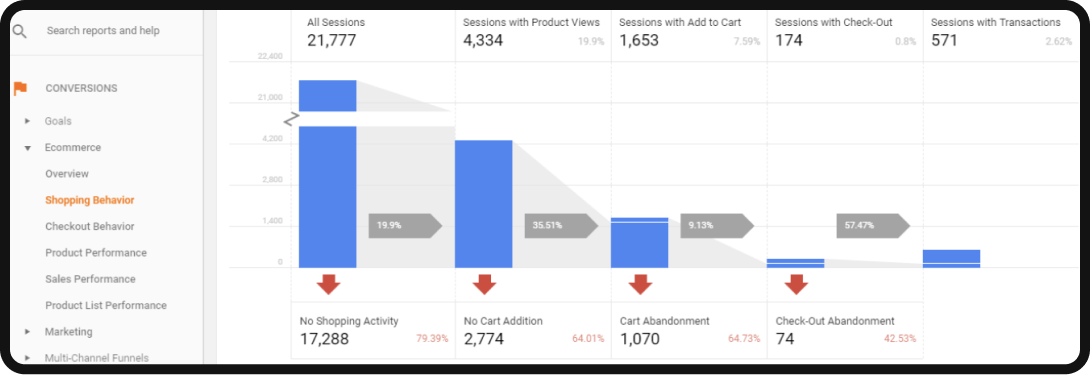
- Conversion Rate: This metric measures the percentage of users who complete a desired action, such as making a purchase or signing up for a newsletter. A high conversion rate indicates a well-performing user journey, while a low rate may signify potential barriers or friction points.
- Churn Rate: Churn rate quantifies the number or percentage of customers who stop using a product or service within a specific period. Understanding churn helps identify retention issues and aids in devising strategies to retain valuable customers.
- Click-Through Rate (CTR): CTR measures the proportion of users who click on a specific link or call-to-action, such as in an email or ad. It helps evaluate the effectiveness of marketing efforts and the relevance of content to users.
- Time on Page: This metric tracks the average time users spend on a particular page. It offers insights into the content’s engagement level and whether it effectively captures users’ attention.
- Bounce Rate: Bounce rate represents the percentage of users who leave a website or app after viewing only one page. A high bounce rate could indicate a lack of relevance or a poor user experience.
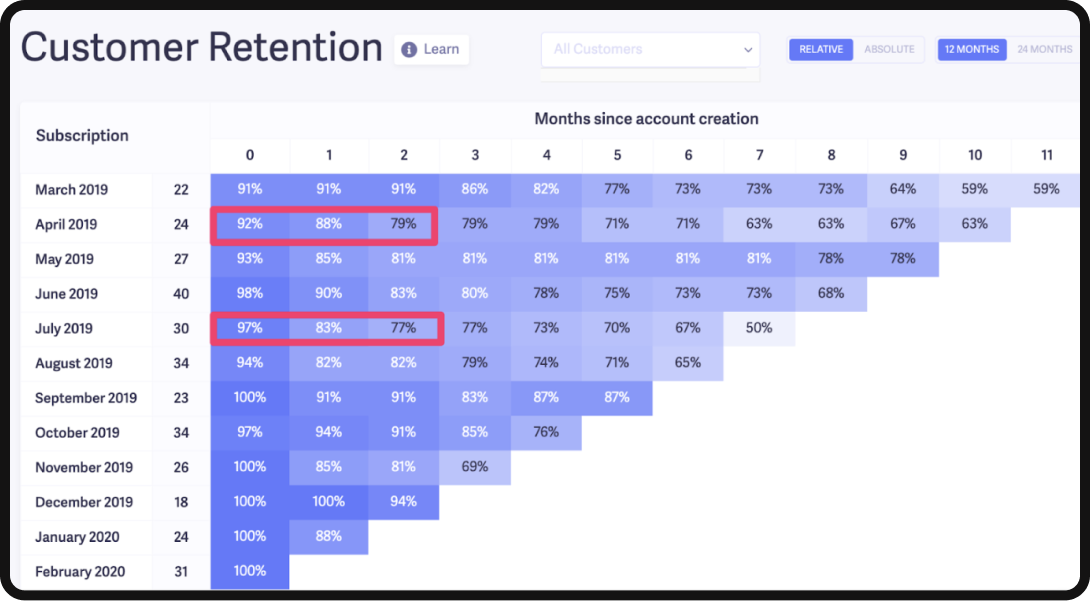
- Retention Rate: Retention rate measures the percentage of users who continue using a product or service over time. A high retention rate signifies a satisfied and loyal customer base.
- Heatmaps and Click Maps: Heatmaps and click maps visually represent user interactions on a webpage, highlighting areas of interest and engagement, as well as areas that users tend to ignore.
Analyzing these key metrics provides valuable insights into user behavior, enabling teams to make data-driven decisions and improve their products and marketing strategies for long-term success.
Unveiling User Behavior
User Onboarding Analysis
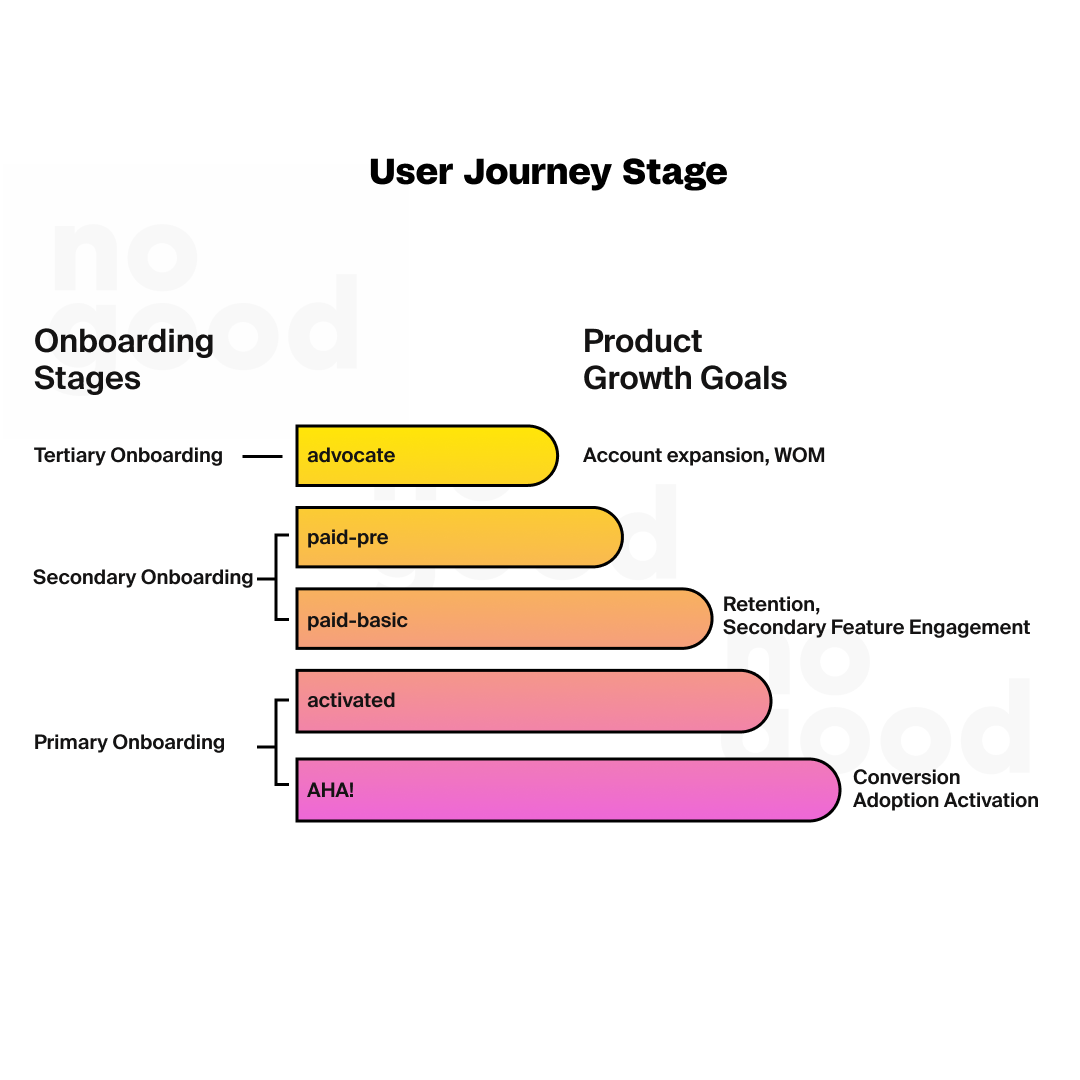
Onboarding analytics is a critical process for understanding how users interact with a product during their first experience. By examining the onboarding journey, product teams can identify potential bottlenecks or complexities that may prevent new users from fully engaging with the product.
Tracking key onboarding metrics, such as time to setup, feature discovery, and dropout rates, helps optimize the onboarding process and ensures a smoother and happier user experience from the start.
Feature Adoption Tracking
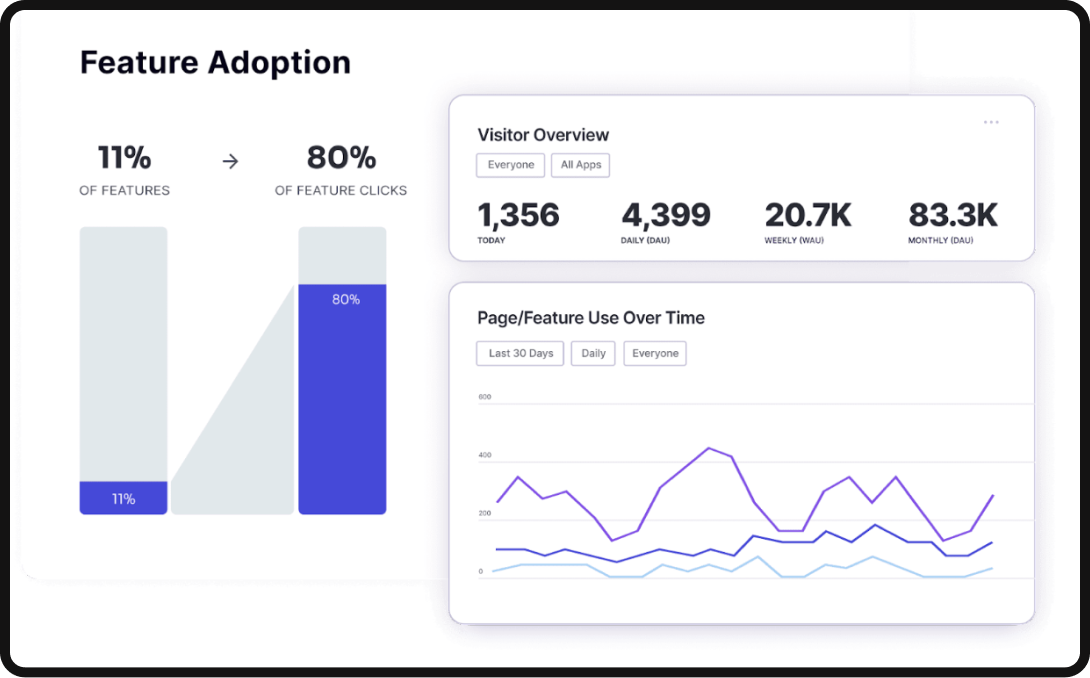
Tracking feature adoption is essential for product teams to determine which features resonate best with users and which may need improvement. By analyzing feature usage patterns, teams can prioritize improvements or updates to underutilized features and identify the most valuable aspects of their product.
Understanding feature adoption also enables product teams to tailor marketing efforts and user training to drive adoption of specific features, which increases the overall value of the product and user satisfaction.
User Engagement Measurement
Measuring user engagement is a key indicator of a product’s success and its ability to retain loyal customers. By analysing user interactions, time spent on the platform, and frequency of visits, companies can determine how actively users are engaging with their product.
High levels of engagement reflect strong interest and satisfaction, while low engagement may indicate the need for improvements or additional incentives to keep users coming back.
Churn Analysis
Churn analysis examines the reasons for user churn or customer loss. By identifying the behavior and characteristics of churned users, product teams can uncover patterns and potential pain points that lead to churn.
With this information, companies can take proactive steps to reduce churn, such as personalizing customer engagement campaigns, troubleshooting product issues, or providing superior customer support. Analyzing customer churn is critical to maintaining a healthy customer base and driving long-term success.
Improving User Experience
Identifying Pain Points
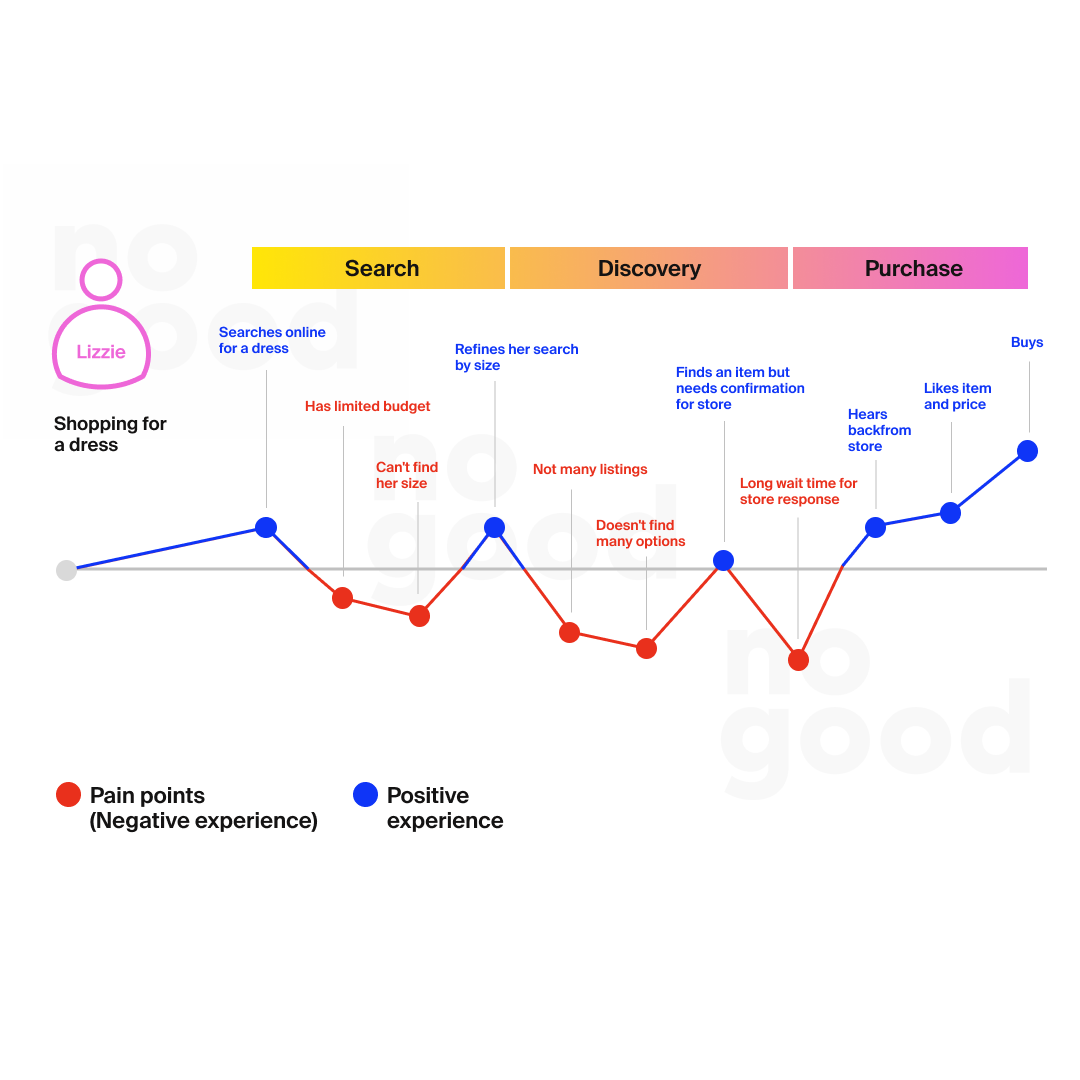
Effective user experience improvement starts with identifying and fixing problems users encounter when interacting with a product or service. This includes analyzing user behavior data to identify areas where users may experience difficulty, frustration, or obstacles.
By actively seeking and understanding these pain points, organizations can prioritize the necessary changes and improvements to create a smoother and more enjoyable user journey. Eliminating pain points directly leads to higher user satisfaction and loyalty, which ultimately leads to higher retention rates and positive word-of-mouth recommendations.
A/B Testing for Optimization
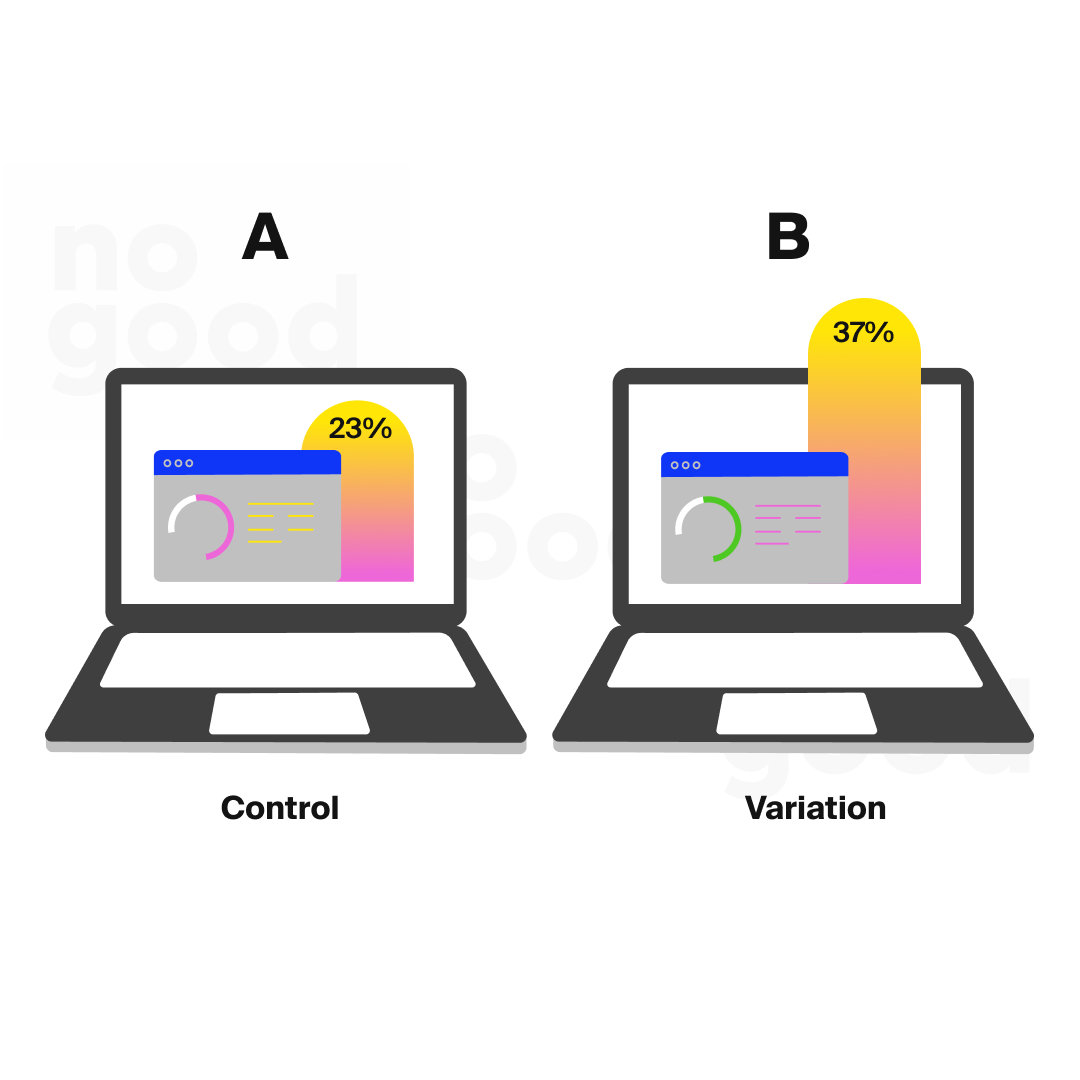
A/B testing, also known as split testing, is a powerful way to optimize user experience. By creating two or more variations of a web page, feature, or design element, teams can compare their performance and determine which version resonates better with users. This data-driven approach enables informed decision making, as the team can analyze real user interactions and behaviors to select the most effective option.
A/B testing helps refine the user experience by implementing changes that are proven to increase engagement, conversions, or other desired outcomes, ultimately leading to an optimized product.
Personalization Based on Preferences
Personalization is an essential aspect of providing a tailored and enjoyable user experience. By leveraging data on user behavior and preferences, companies can tailor content, recommendations, and interactions to individual user needs. Personalization creates a sense of relevance and value for users and increases their engagement and satisfaction.
By tracking user behavior, such as past interactions, purchase history, and browsing habits, companies can dynamically tailor their offerings to meet specific user interests and provide a meaningful and memorable experience. Personalization not only increases user engagement, but also fosters a deeper bond between users and the brand, leading to better loyalty and advocacy.
Data-Driven Decision Making
Analyzing Trends for Planning
Data-driven decision making enables organizations to identify and analyze trends that can influence their future strategies. By examining historical data, user behavior patterns, and market trends, companies can anticipate changing consumer needs and preferences. This proactive approach enables them to plan ahead, efficiently align their resources, and stay ahead of the competition.
Whether it’s predicting seasonal fluctuations, identifying emerging markets, or adapting to changing customer needs, analyzing trends through data-driven insights is essential for sustainable growth and success.
Prioritizing Product Updates
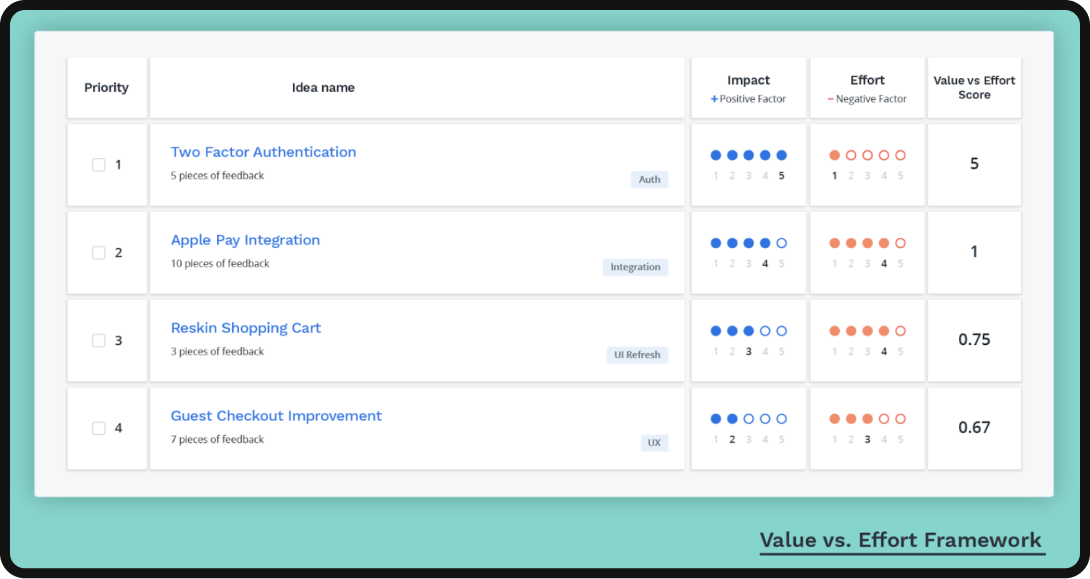
For product teams, deciding which updates and features to prioritize can be a challenge. Data-driven decision making can help by providing objective evidence of what users really value and need.
By analyzing user behavior metrics such as feature adoption, user feedback, and interactions with customer support, product teams can identify areas that need improvement or innovation. This approach helps them focus their efforts on the most impactful updates, ensuring that resources are allocated efficiently and that the product evolves in a way that resonates with the user base.
Integrating Customer Feedback
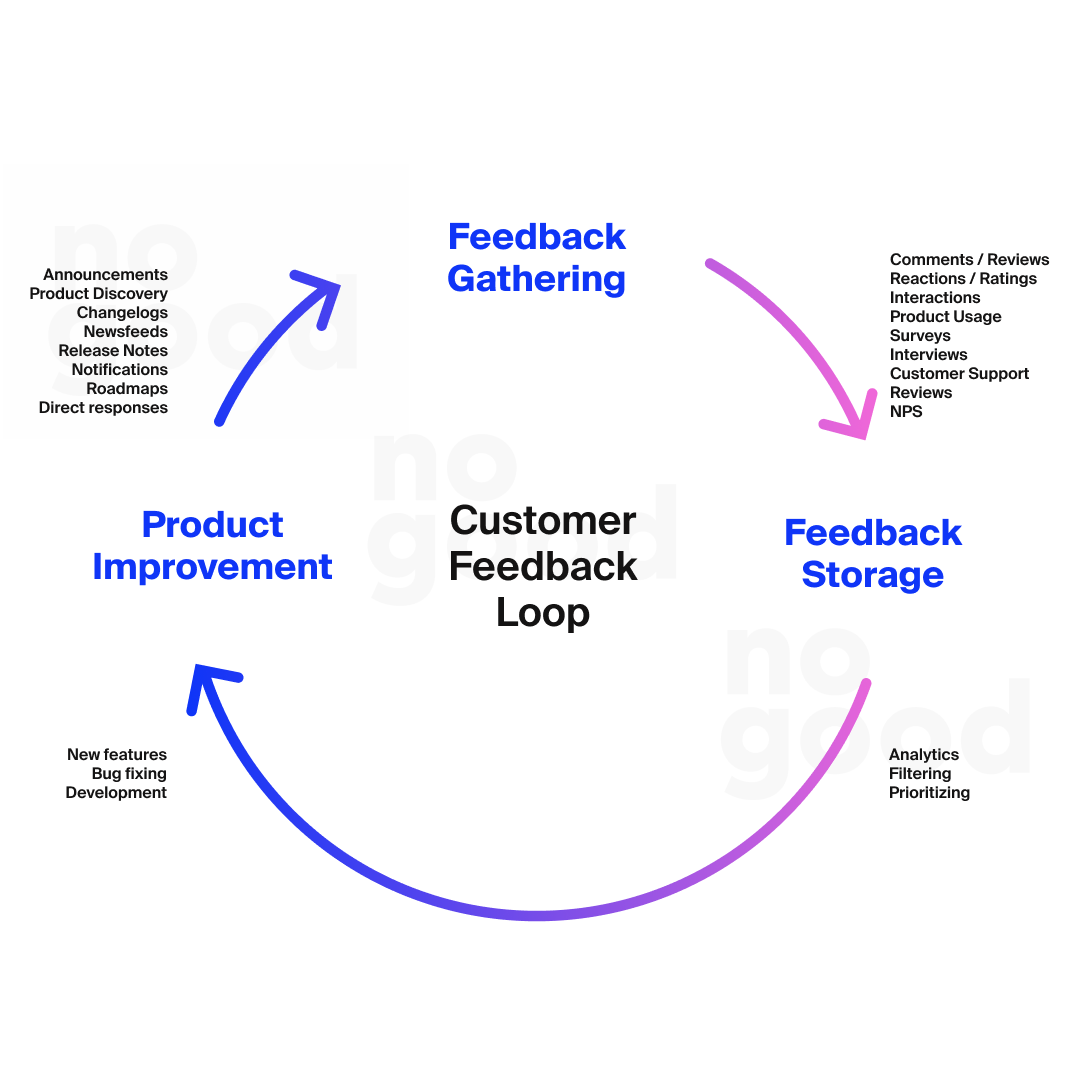
Customer feedback is an invaluable source of insight for any business. Data-driven decision making involves not only collecting feedback, but also analyzing it to understand customers’ problems, desires, and satisfaction. By integrating this feedback into the decision-making process, companies can better tailor their products and services to meet customer expectations.
Whether through surveys, social media listening, or direct interactions, incorporating customer feedback enables companies to build closer relationships with their audiences, build loyalty, and foster a customer-centric culture. It also helps identify areas for improvement and prioritize product updates that directly address user needs and concerns.
Predictive Analytics
Making User Behavior Predictions

Predictive analytics uses historical user behavior data, machine learning algorithms, and statistical models to predict future user actions and preferences. By analyzing patterns and trends, companies can make informed predictions about how users are likely to behave in specific scenarios.
These predictions help product teams anticipate user needs, design personalized experiences and develop targeted marketing strategies. Whether it’s predicting customer preferences for product recommendations or predicting user activity for new features, predictive analytics helps companies stay ahead of the curve and deliver exceptional user experiences.
Preventing Churn Proactively
Preventing customer churn is a top priority for companies that want to retain their valuable customers. Predictive analytics plays a critical role in identifying potential churn risks before they escalate. By analyzing user behavior patterns that precede churn, such as decreased usage, declining engagement, or unanswered support tickets, companies can proactively intervene and address issues.
This can include targeted communications, personalized offers, or proactive customer support to win back churned users. The ability to predict customer churn enables marketing and customer success teams to take proactive measures and implement strategies that increase customer satisfaction and loyalty, which ultimately lowers churn rates and increases long-term business success.
Real-Life Case Studies: Success Stories
Spotify’s Enhanced User Experience (UX)

Spotify, the renowned music streaming platform, used SaaS analytics to drive adoption through an improved user experience. By analyzing its products, Spotify identified a major pain point for users – difficulty with the search bar. To address this, it launched a comprehensive user experience improvement initiative.
Spotify’s data-driven approach resulted in simplified menus that cater to users’ music tastes by focusing on personalized recommendations. Dropdown folders for organized playlists were also introduced, allowing users to effortlessly manage their music preferences.
The result of these user experience optimizations was a significant increase in user engagement and adoption. The data-driven enhancements to Spotify UX not only improved the user experience of the platform, but also ensured that users were able to take advantage of it more quickly, further driving loyalty and growth of the platform.
Airbnb’s Exceptional UX Design

Using SaaS analytics, Airbnb analyzed user behavior and preferences to improve adoption through UX design. The company identified the issues travelers face when searching for accommodations and implemented data-driven changes to improve the user experience.
Through A/B testing, Airbnb tested different layouts and user interfaces to optimize its homepage. By closely monitoring user interactions and engagement metrics, it identified the most effective design elements that resonated with users and ultimately increased adoption rates.
In addition, Airbnb used data analytics to personalize the user experience. By analyzing user data such as location, preferences, and previous bookings, tailored recommendations and suggestions were provided for a personalized experience. This personalization strategy increased user engagement and adoption, leading to higher user satisfaction and retention.
In addition, Airbnb used insights from the data to improve the booking process. By tracking user actions and identifying friction points, the booking process was streamlined and made more intuitive and efficient. As a result, users experienced a smoother and more enjoyable booking process, leading to higher adoption and repeat bookings.
HubSpot’s Churn Reduction

In its quest to reduce customer churn, HubSpot used SaaS analytics to identify pain points and improve customer satisfaction. The company conducted a comprehensive analysis of customer interactions and engagement metrics to uncover patterns and potential churn triggers.
By closely monitoring customer behavior, they were able to identify early warning signs and proactively engage with at-risk users through personalized communications and targeted offers, effectively reducing churn rates. HubSpot’s data-driven approach also included analyzing user feedback and conducting sentiment analysis to determine customer satisfaction.
The sentiment data was used to identify areas for improvement and prioritize product enhancements based on customer needs and expectations. In addition, by tracking customer journey touchpoints, HubSpot streamlined onboarding processes and customized experiences to individual user preferences to create a positive user experience from the start and drive long-term customer loyalty.
In addition, HubSpot used predictive analytics to forecast customer behavior and anticipate potential churn events. By identifying users at higher risk of churn, customized customer retention strategies were implemented, such as offering exclusive discounts or providing personalized support to keep customers engaged and satisfied.
Mode’s Data-Driven Decision Making

In a strategic move to increase sales, Mode used data-driven decision making to improve its pricing strategy. By analyzing customer segmentation metrics, Mode identified a high-value customer segment that showed a high willingness to pay for premium features. Financial metrics were used to assess the potential impact of introducing a new tier with advanced analytics capabilities for this segment.
Through A/B testing, Mode tested different pricing structures and monitored conversion rates to determine the most effective pricing model for the new tier. The data showed that the new tier was well received by the identified high-value segment, resulting in higher conversion rates and customer adoption.
In addition, Mode used customer satisfaction measurements to gather feedback on the features and overall value of the new tier. Addressing customer concerns and iteratively improving the offering ensured a high level of customer satisfaction, which drove loyalty and advocacy within the high-value segment.
As a result of these data-driven decisions, Mode saw a significant increase in revenue from the introduction of the new tier while maintaining a high customer retention rate within existing customer segments. This success is an example of how data-driven decisions can positively impact revenue growth and overall business success for a SaaS company.
Netflix’s Data-Driven Delight
Through SaaS analytics, Netflix has revolutionized playtime through recommendations. Netflix’s recommendation engine analyzes user behavior, such as viewing habits, genre preferences and ratings, to make personalized content suggestions. This data-driven approach increases user engagement and retention as viewers discover relevant movies and series.
In addition, Netflix optimizes its content library using data analytics. Audience trends and performance metrics inform content acquisition and creation decisions. This strategy ensures a diverse and attractive offering that attracts new users and keeps subscribers engaged.
Netflix’s commitment to data-driven decisions also extends to user interface design through A/B testing. By testing different layouts, features, and experiences, insights are gained for continuous improvement. This iterative process refines the platform, improves the overall user experience, and drives adoption and usage.
The Future of SaaS Product Analytics
Advancements in Technology & AI
The future of SaaS product analytics is very promising thanks to the continued evolution of technology and the integration of artificial intelligence (AI). As data volumes continue to grow, sophisticated AI algorithms will play a central role in extracting meaningful insights from massive data sets.
AI-powered analytics tools will enable product teams to identify complex patterns, trends, and correlations in user behavior that might otherwise have gone unnoticed. These advanced analytics capabilities will enable companies to make more accurate predictions, personalize user experiences at scale, and proactively address customer needs, ultimately leading to higher customer satisfaction and retention.
Impact of Privacy Regulations
The future of SaaS product analytics will also be significantly shaped by evolving privacy regulations and consumer privacy concerns. Stricter privacy laws and a greater emphasis on user consent and transparency will drive product teams to adopt more ethical data collection practices.
Companies must strike a balance between collecting important user data for analytics and respecting users’ privacy rights. Implementing privacy-friendly analytics practices, such as anonymization and secure data storage, will be paramount.
While challenging, these regulations will force companies to prioritize data security and build trust with their customers. Companies that prioritize data protection and comply with regulations will not only strengthen their relationships with users, but also demonstrate their commitment to responsible data handling.
In summary, the power of data-driven decision making cannot be underestimated in today’s competitive landscape. Companies such as Spotify, Airbnb, HubSpot, Mode, and Netflix are examples of how harnessing the potential of product analytics can drive success in a variety of industries. By understanding user behavior, preferences, and pain points through SaaS product analytics, companies can optimize the user experience, improve customer satisfaction, and foster long-term relationships.
The valuable insights gained from metrics such as KPIs, churn rates, user engagement, and customer satisfaction enable companies to make informed decisions, prioritize development, and continuously improve their products and services. With data-driven strategies, companies can stay ahead of the curve, deliver exceptional offerings, and secure a strong position in the ever-evolving marketplace.
Harnessing the potential of product analytics will continue to be critical to developing innovative, user-centric solutions that drive sustainable growth and success for companies worldwide.