

SEO reporting is how you prove your hard work is paying off. It’s an essential component of your strategy that shows clients, stakeholders, and bosses the results of your SEO efforts. Beyond numbers, it also provides an opportunity for your team to sync on your strategy and plan content to ensure you are aligned and on track to meet your goals.
In this article, we’ll help you become an expert SEO report builder by showing you how to build one with recommended templates and tools.
What Is an SEO Report?
SEO reports offer insights into your website’s performance and health through an analysis of user behavior and website data. An SEO report consolidates all of this data, providing actionable insights for optimizing and improving your website.
Best Practices for Building SEO Reports
Since SEO reporting relies on precise, organized data to improve website performance and traffic, here are some best practices for creating SEO reports.
Organize Your Data With Period-Over-Period Comparisons
Period-over-period comparisons help you compare your website’s performance with previous weeks, months, quarters, or years to show how the site changed over time.
By sectioning your data into chunks of time for comparison, you can measure your performance by determining how your website has changed over time.
By comparing your data across time, you can also get a clearer picture of whether any changes you made to your website had a tangible impact, whether positive or negative.
Define Clear Objectives Supported by Contextualized Data
For an SEO report to be impactful, the data within it must be explicitly tied to a purpose.
Start by setting specific objectives, such as increasing organic traffic or improving conversion rates. Then, use the data in your report to demonstrate the results of your work and prove that your SEO efforts are on track to meet those goals. The numbers you include should directly support clearly defined growth objectives.
A high-quality SEO report will also explain what factors influenced the data you are presenting, and how these factors can change in the future.
Segment Data by Specific Factors
Segmenting data by factors like keywords, location, and user demographics can help identify valuable patterns and trends, which can provide a deeper understanding of how users interact with your site.
For example, creating specific groups for your data allows you to identify which keywords drive the most traffic, which locations perform well, and which user demographics engage with your site the most.
Interpret the Data & Provide Actionable Insights for Improvements
After you pull and organize your data, your next step is to interpret it and provide actionable insights. This is the most important part of building an SEO report: it’s when you translate raw numbers into a clear plan.
For example, you might see that a blog post’s organic traffic dropped by 30%. Simply reporting this is not an insight. An insight is figuring out why that happened. Did a key keyword’s ranking drop? Did a competitor publish a better article? Was there a recent Google algorithm update? The insight is the conclusion you draw from analyzing all these different data points together.
To turn insights into a plan, follow these steps:
- Look for anomalies: Start by looking for spikes, drops, or other changes in your key metrics.
- Ask “why”: For every trend you find, determine why it’s happening. If a page’s traffic dropped, check its keyword rankings, look for crawl errors, or see if a competitor outranked it.
- Segment your data: Don’t just look at overall numbers. Break your data down by keywords, location, or user demographics to find hidden insights.
- Connect data to business goals: Always relate your findings back to tangible objectives.
- Turn insights into actions: This is where you transform your analysis into a to-do list. For example, the insight that a blog post is losing rankings becomes a recommendation to update it with new information and more internal links.
By following this process, your report gives your team the guidance needed to make improvements and shows stakeholders a clear path forward.
How to Build an SEO Report
While we just went over some best practices, we’re now gonna clarify how exactly you should build an SEO report.
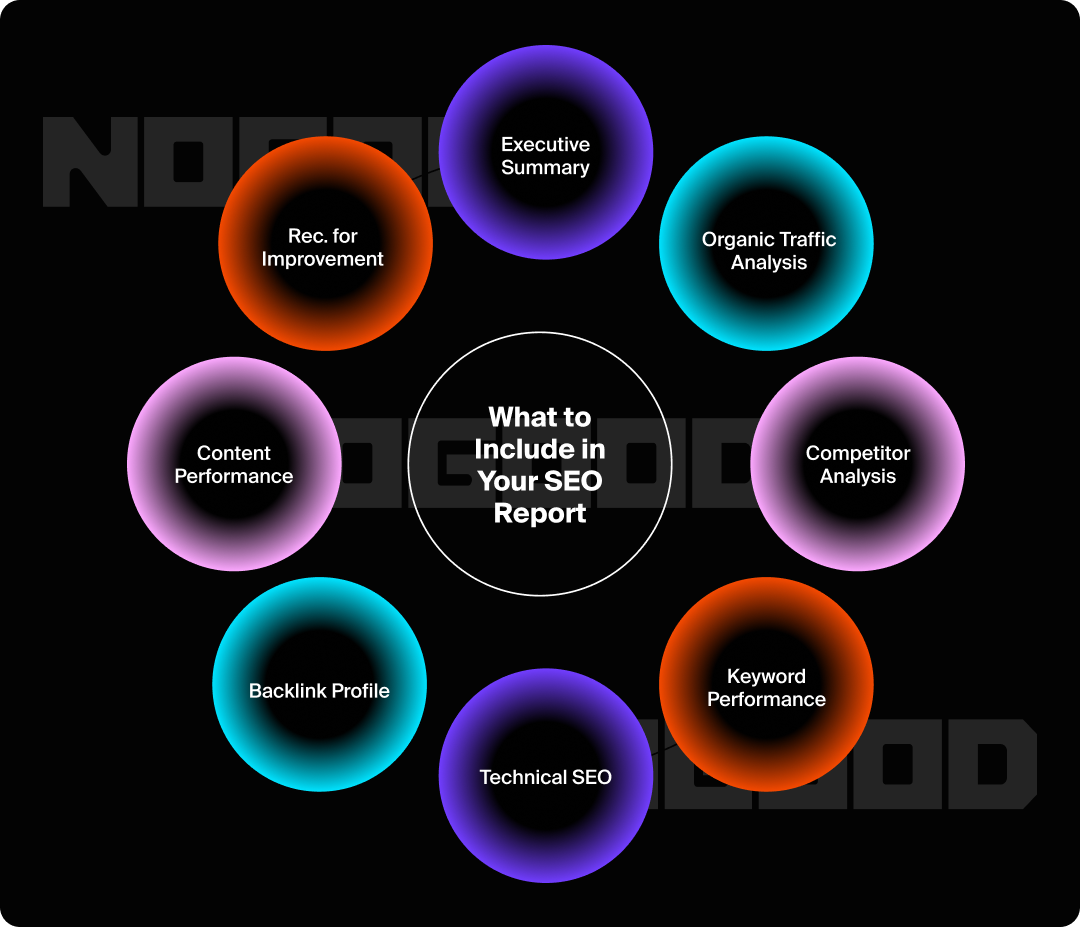
Executive Summary
The executive summary is basically a TL;DR of your SEO report; It should give your client or boss a quick overview of your report’s most important findings and the actions needed to improve them.
Like all sections of your report, this section should be formatted as concise bullet points with key takeaways so busy clients don’t need to read the entire report.
Organic Traffic Analysis
Organic traffic refers to the number of visitors who arrive on your site after searching for it on a search engine.
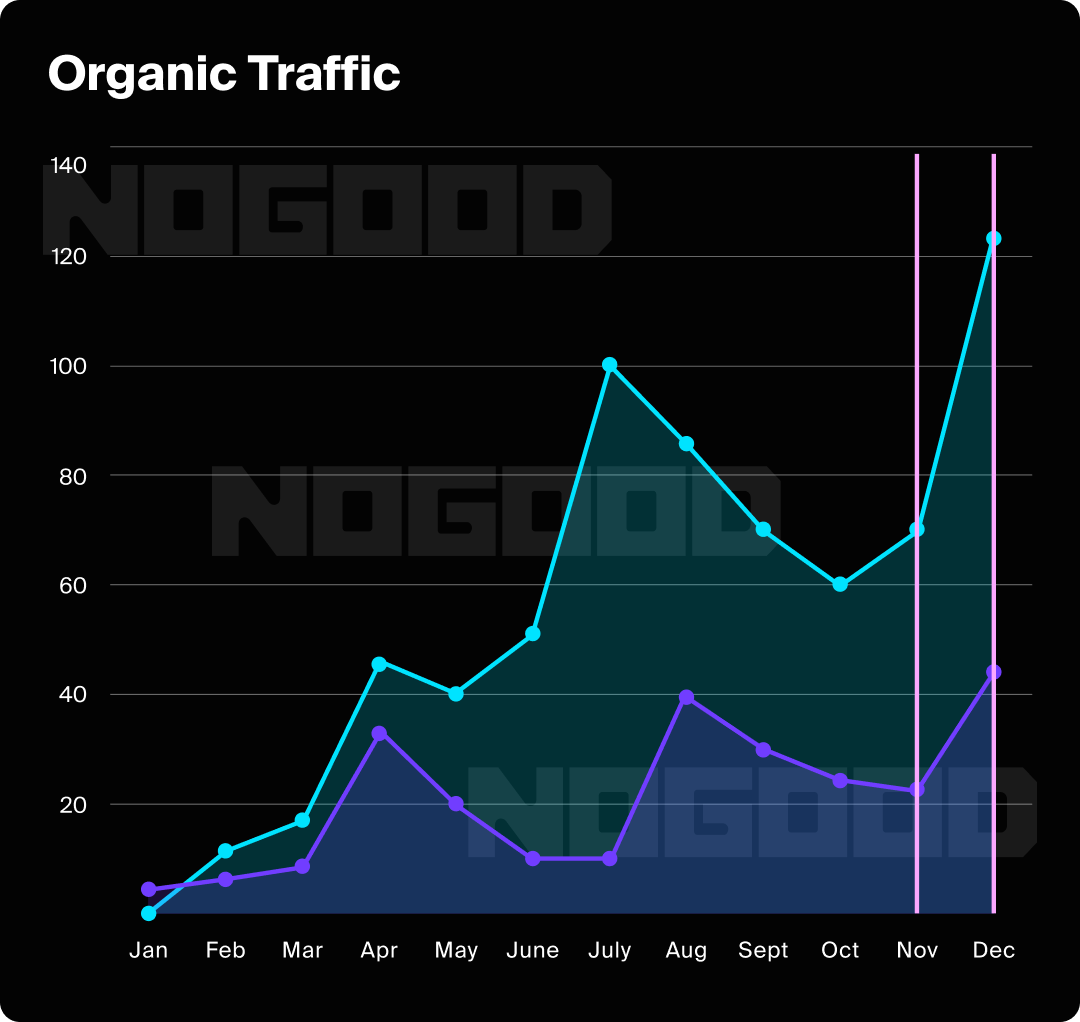
Often, the best way to present this data is with a graph or period-over-period comparison chart.
This data can show your team how your content and website optimizations are performing.
Organic traffic data can be segmented into comparisons based on user demographics, top keywords, impressions, and clicks.
Keyword Performance
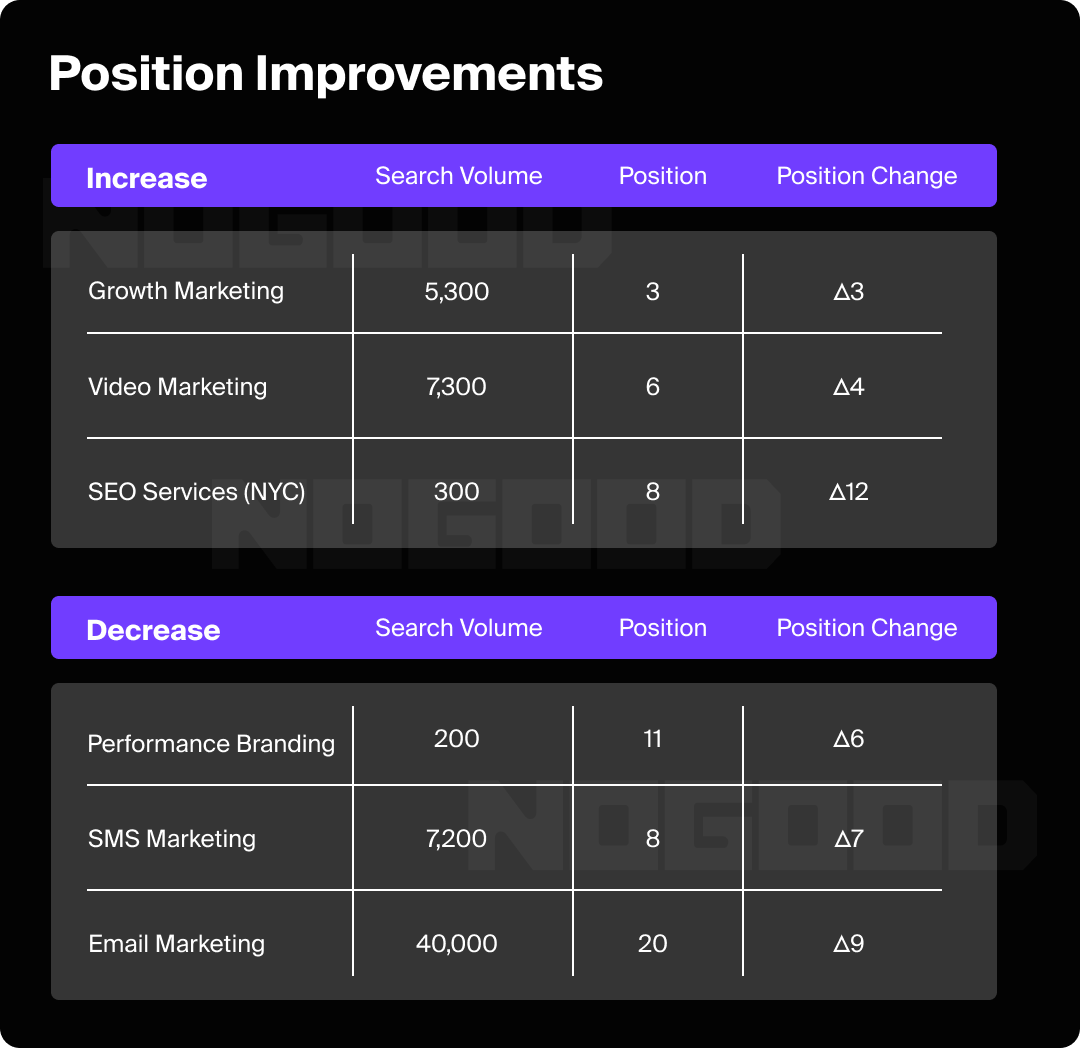
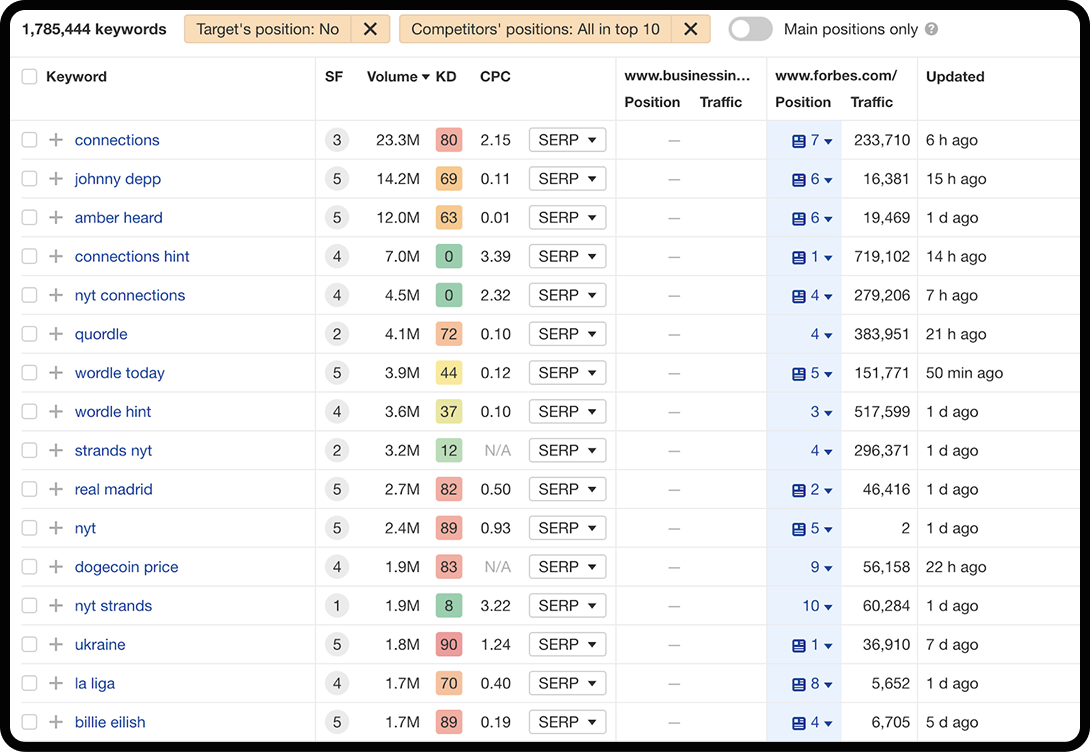
Keyword rankings are an essential KPI that measures how high your content ranks in the SERP. Collecting data on keyword performance, trends, and competitor keywords can help determine which keywords you should target in your content.
You can collect data on your top-performing keywords and keywords that have lost traffic to see where you are doing well and where you need to optimize. You will also want to take into account search volume for each keyword, your current position, and the percentage of organic traffic that the article gained or lost over the period.
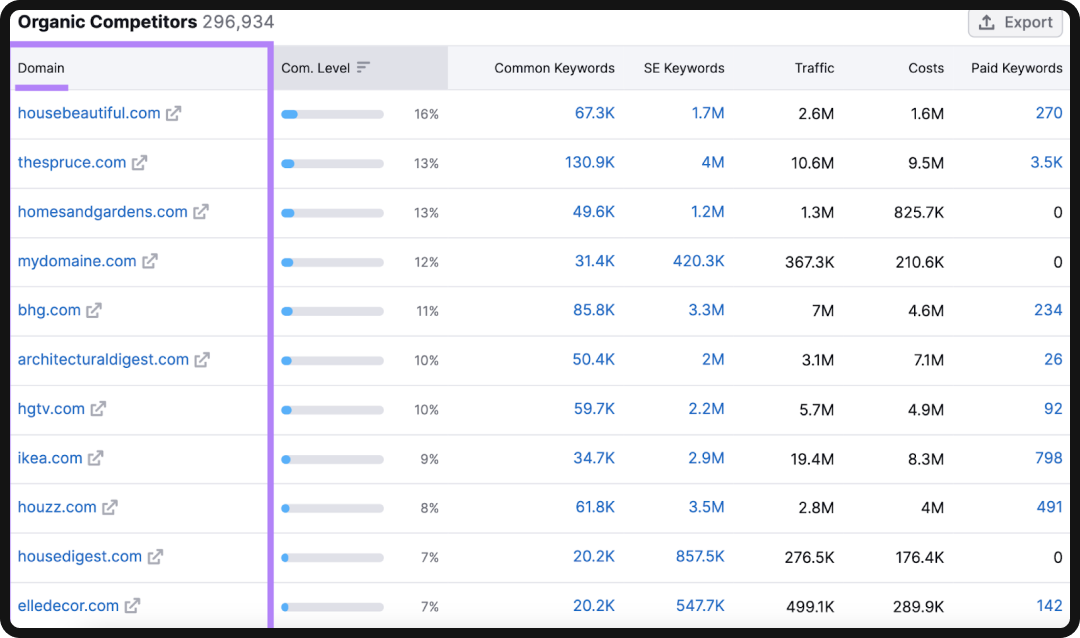
Competitor Analysis
Performing competitor analysis helps you leverage keyword research and optimization to get ahead of your competitors on SERPs.
This data can help your team brainstorm new blog topics and pinpoint optimization opportunities to help you outrank your competitors.
You can discover keywords your competitors currently rank for in Ahrefs so you can create content to compete with them in SERPS.
By using a competitive analysis tool on a site like Semrush, you can filter by keyword difficulty to find keywords that are easy to rank for, and look at a list of your organic competitors and how their content performs.
To make this section of your report beefier, you can include a map or chart of where your website stacks up against your competitors.
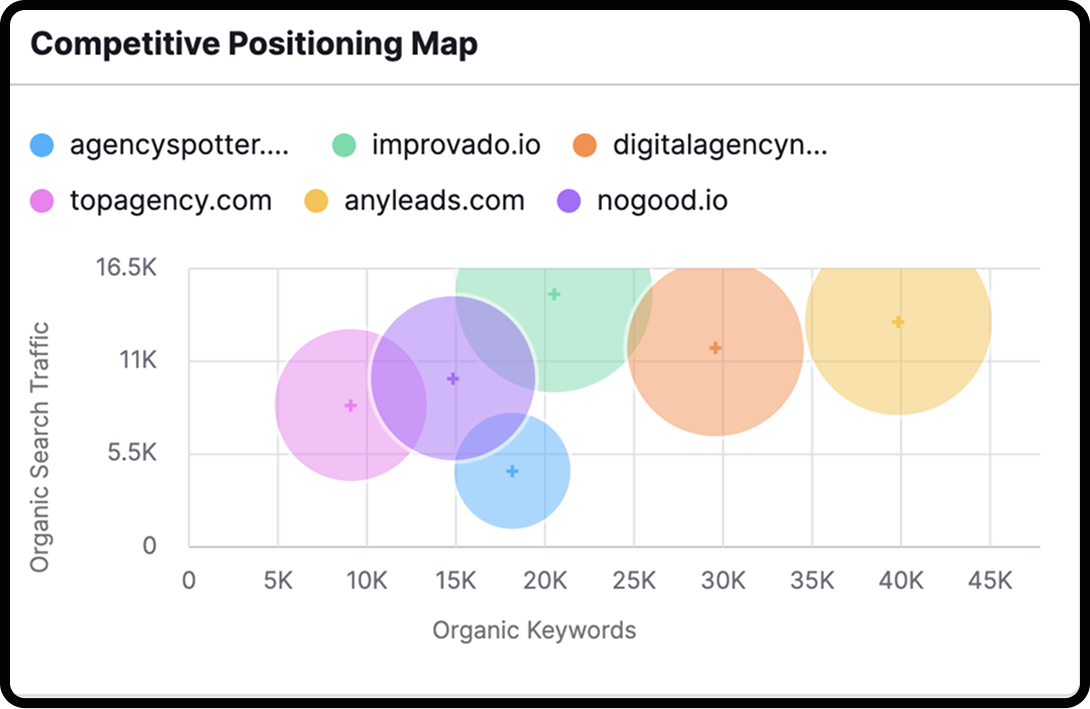
You can also choose your top five competitors in Semrush or Ahrefs and compare their traffic and organic keywords against your own to see how you compare.
Technical SEO
The technical SEO section of your report will outline any technical issues found, like broken links, slow page speed, redirects, and more. The best way to discover these issues so that you can properly report on them is by running a site audit.
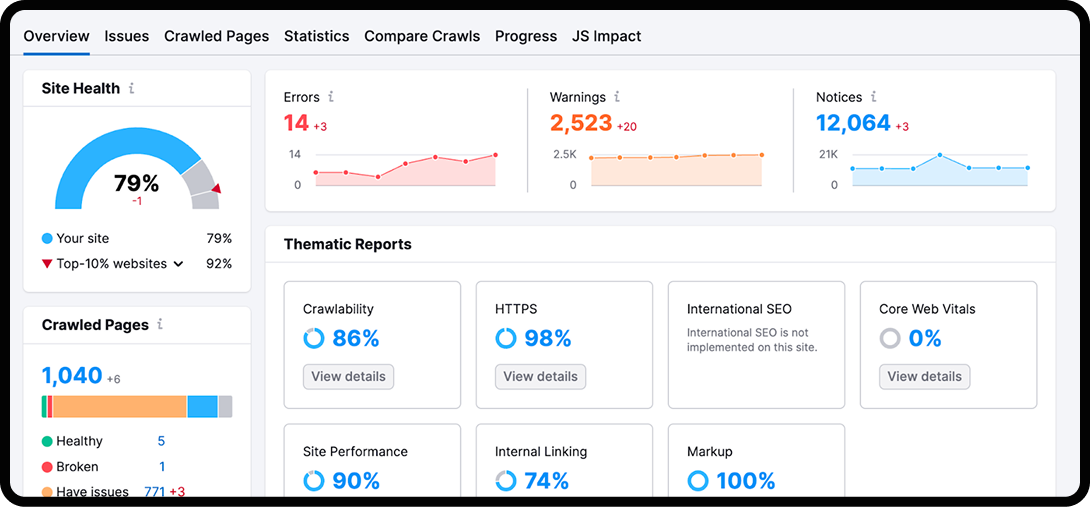
Site audits often find a barrage of problems, so it’s important to focus on the most critical first. Consider the warnings and error messages that are most important to your business and determine their effect on your overall site health. Some of these may include:
- Blocked by robots.txt: This tells search bots what to crawl, and if important pages are blocked, they won’t appear in search results.
- Noindex tags: These tags tell search engines not to add a page to their index, potentially leading to important pages being missing from search results.
- Server errors (5xx codes): These prevent search bots from crawling a page, and if they’re repeated, it can lead to a site-wide drop in rankings.
- Slow page speed: A slow site can result in fewer engaged sessions. Since Google uses Core Web Vitals to measure page experience, this can worsen rankings.
- Duplicate content: Having duplicate content may make it difficult for search engines to decide which is most relevant, leading to both versions ranking poorly.
- Broken internal links (404 errors): Too many broken links can create poor user experience (UX) and decrease authority.
- Missing or misconfigured SSL certificate: Since Google uses HTTPS as a ranking signal, it may penalize your rankings if it’s not properly implemented.
You can use Screaming Frog or Sitebulb to run a site audit to uncover technical SEO issues on your website. From there, you can export the data into an app on Google Workspace to create your reports, which we’ll go over in more depth later.
It can be easy to get caught up in the technical details of your site audit, but you should keep the data simple for your report by reporting on the most critical issues or those that appeared repeatedly.
Backlink Profile
Backlinks are the number of external links from another site to yours, and are important in maintaining domain rating and authority.
Your report should include the number of links your website gained during a specific time frame, the total number it currently has, and the domain rating of every site that links to yours.
Since backlinks help you build authority, this data will illustrate your progress in building your backlink profile and increasing your domain rating.
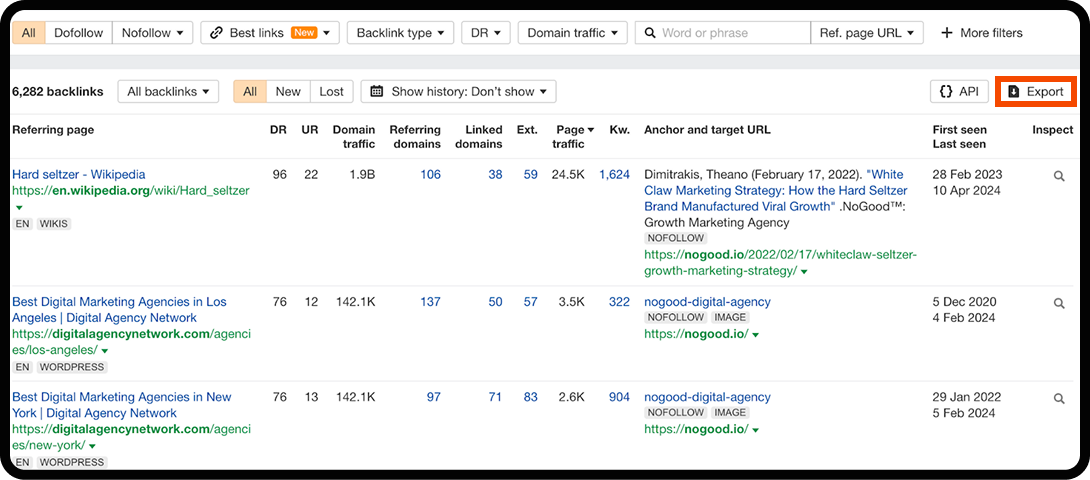
You can use Ahrefs to monitor your backlink profile, and toggle for filters like dofollow links, best links only, types of backlinks, etc.
Once you have adjusted the filters, you can export your backlinks into Google Sheets and Looker Studio to organize your numbers into tables and graphs.
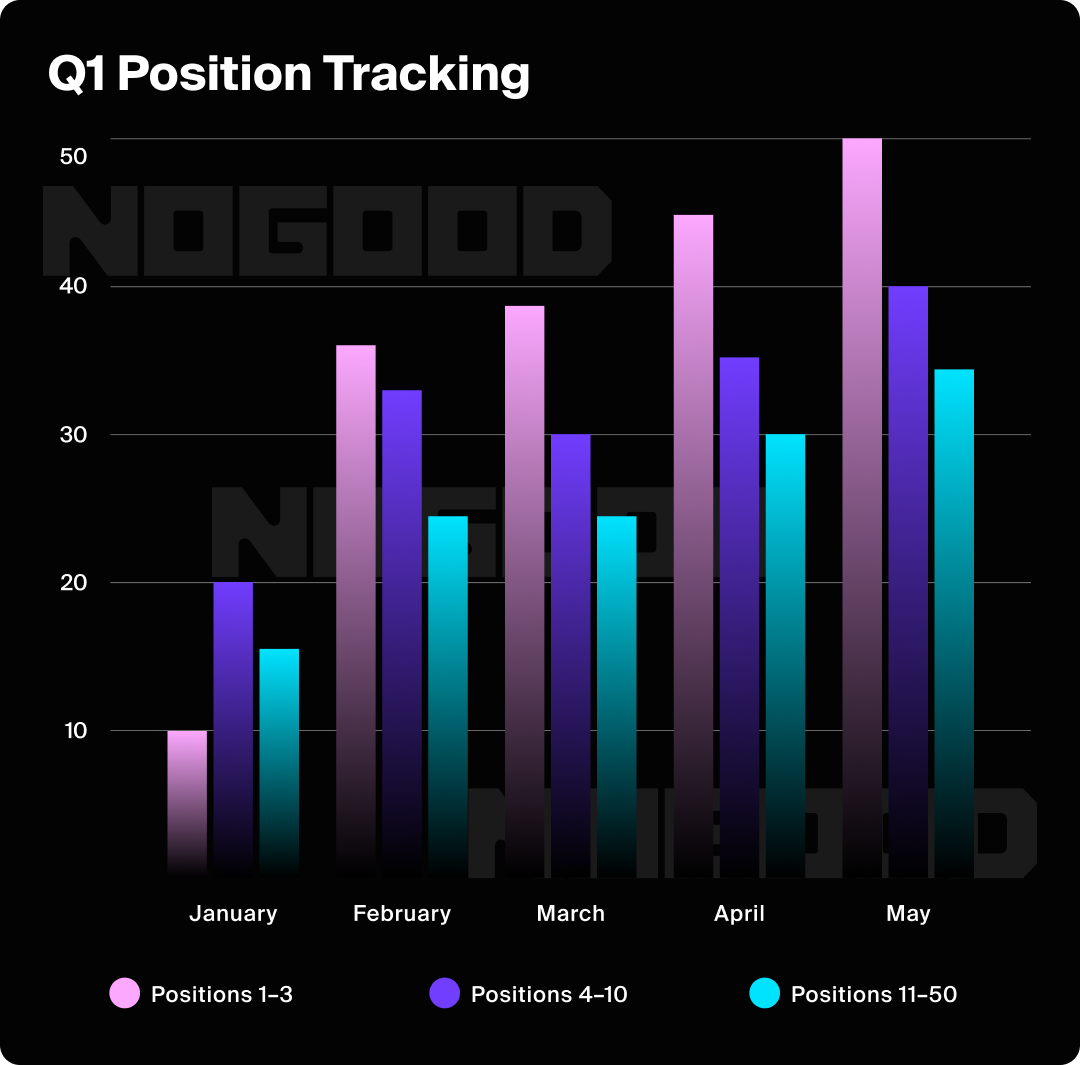
Content Performance
As you add more content to your website, you’ll want to monitor the performance of your new pages so you can update them. This data also helps inform your content strategy by illustrating which types and categories of content are performing well.
In this section of your SEO report, you’ll want to include position tracking data, which shows how you’re ranking in the SERP for any given topic over time. You can display this information in a chart or a bar graph.
For the content performance section of your report, you should include the following:
- Top-performing pages with the number of clicks and impressions for each.
- Pages that are declining in organic traffic and impressions for each.
- Recommendations for improvement in content creation and strategy.
You can look at:
- Early Metrics: For new content, look at metrics that indicate initial traction, such as impressions and average position in the first 30-60 days. This tells you if the content is being seen by search engines and where it’s starting to land in the rankings.
- Specific Keyword Groups: Use an SEO tool like Ahrefs to create a dedicated keyword group for each new piece of content. This allows you to monitor the performance of your primary and secondary keywords for that specific page, giving you a more granular view of its success.
- User Engagement: Look at metrics like engaged sessions, time on page, and pages per session for your new content in Google Analytics. If a page has a high bounce rate and low time on page, it may be a sign that the content isn’t meeting user expectations, and you may need to revise it.
Recommendations for Improvement
The final section of your report will decode the data from each section and recommend actionable steps to optimize your website.
This is where you’ll flesh out your strategy and optimization plan for your website. It’s a chance for you and your team to collaborate and use your data and insights to brainstorm ways to optimize your website and drive organic growth.
From there, you can delegate tasks to your team members and determine the game plan for the next period.
What Are Some SEO Report Builders?
While we discussed some tools already, we’re gonna take a deeper dive into some of the ones that can help you compile the data for your report.
Looker Studio
Google’s Looker Studio provides intuitive templates for visualizing SEO and website data.
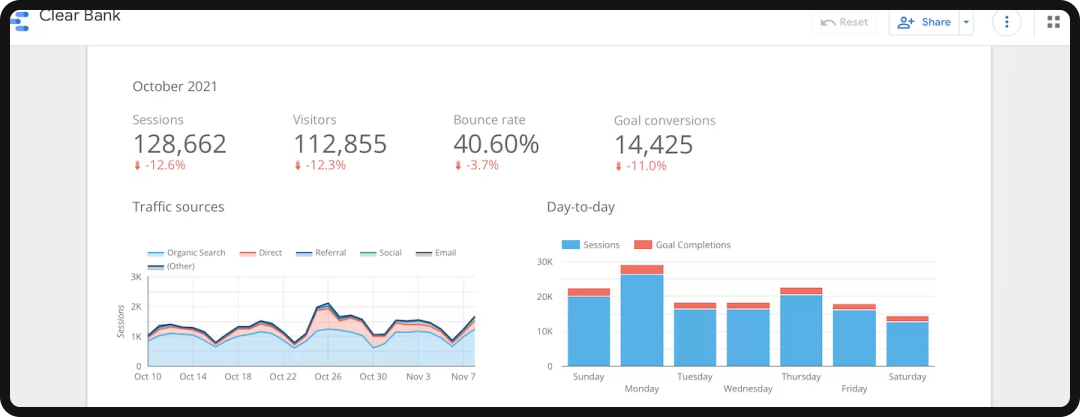
You can create your own custom report or use one of Looker Studio’s templates to create stunning visual reports for your data.
These templates can help you communicate your findings effectively, which is especially useful when dealing with complex or large data sets.
Pros:
- Free and highly customizable: Create unique, branded reports from scratch or use one of the many available templates.
- Powerful data blending: Easily connect and blend data from multiple sources (like Google Analytics, Search Console, and Semrush) into a comprehensive report.
- Excellent for visualization: Looker Studio excels at creating interactive charts and graphs to help you tell a compelling story with your data.
Cons:
- Steeper learning curve: While templates are easy to use, creating a custom report with multiple data sources can be challenging for beginners.
- Can be slow with large data sets: Reports can sometimes load slowly when processing and displaying a large amount of data.
- Limited data cleaning features: You may need to clean or transform data in its source platform before importing it to Looker Studio for a clean report.
Semrush SEO Report Templates
Semrush also offers quality report templates that you can tailor to your website data.
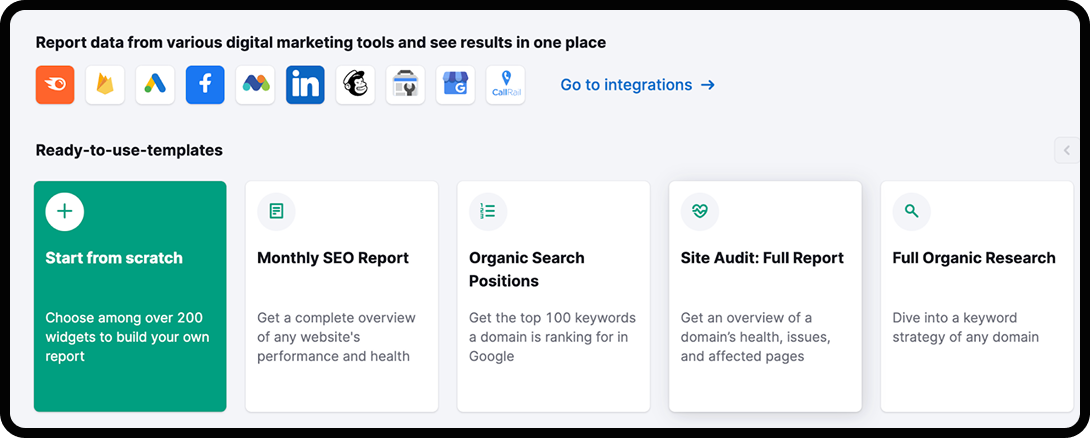
You can integrate it into other platforms, like Looker Studio and Google Analytics, to seamlessly share data across these verticals and add it to your reports.
Semrush makes it easy to create easy-to-follow reports by automatically pulling and compiling your data, eliminating the need to create reports manually.
Pros:
- Automated and efficient: Semrush automatically pulls and compiles data from its expansive toolkit, saving you significant time on manual report creation.
- All-in-one data source: You can include data from competitor analysis, backlink audits, keyword research, and more in a single report, all from within Semrush.
- Pre-built templates: Semrush’s templates are designed with SEO in mind, so they are ready to go and require minimal setup.
Cons:
- Paid tool: Unlike Google’s free offerings, access to Semrush’s full reporting features requires a paid subscription.
- Limited customization: While templates are customizable, they are not as flexible as a tool like Looker Studio, which allows for total freedom in design.
- Data is contained within Semrush: While you can integrate with other tools, the core data is tied to the platform, so you’re reliant on its data sources.
Google Analytics
GA4 is a powerful analytics tool that provides detailed insights into your website’s performance. It quantifies important metrics such as page views, engaged sessions, and conversion rates.
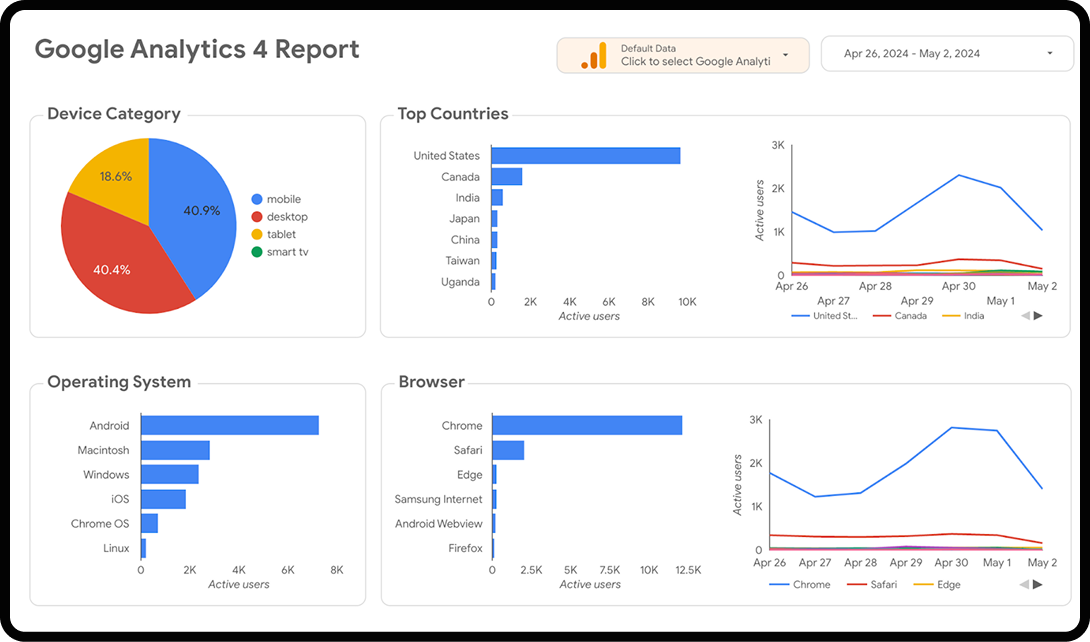
By analyzing this data, you can better understand how users interact with your site so you can identify areas for improvement. GA4 also tracks user behavior across multiple devices and platforms, giving you a more complete picture of your audience and their behavior.
You can import your GA4 data into Looker Studio to create comprehensive reports on your analytics.
Pros:
- Free and powerful: GA4 provides a vast amount of data for free, making it an essential tool for any website owner.
- Detailed user behavior insights: It provides in-depth data on how users navigate your site, which content they engage with, and where they convert.
- Holistic user tracking: GA4’s cross-platform and cross-device tracking gives you a more complete view of the customer journey.
Cons:
- Steep learning curve: GA4’s interface and new event-based data model can be confusing and challenging for new users.
- Privacy limitations: Due to increasing privacy regulations and cookie blockers, GA4’s data may not always be 100% accurate.
- Lacks direct SEO metrics: While it tracks traffic and behavior, it doesn’t provide specific SEO metrics like keyword rankings or technical crawl errors.
Google Search Console
Google Search Console provides insights into search performance metrics like CTR, organic traffic, average position, and impressions.
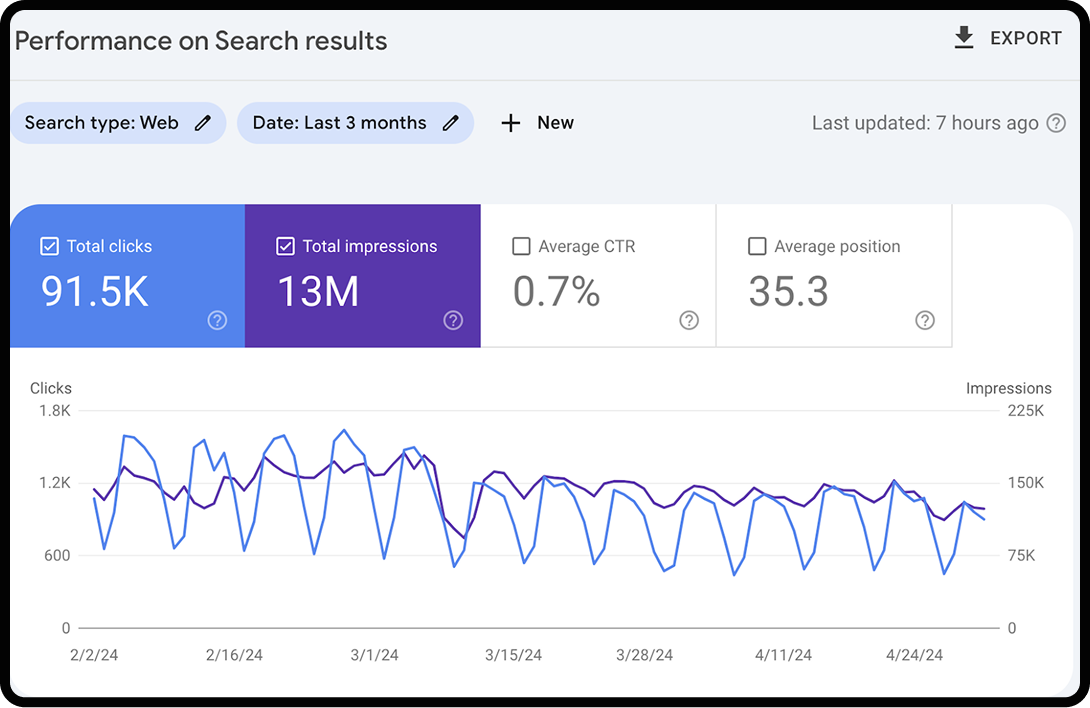
GSC is best for monitoring your website’s performance and presence in Google Search results, helping you to track organic traffic, identify and fix technical issues, improve your site’s SEO, and submit sitemaps.
Like GA4, you can import data from GSC to Looker Studio to create visual reports of your website data.
Pros
- Direct from Google: The data comes straight from Google’s index, so it is the most accurate source for search performance.
- Shows specific keyword data: GSC provides a list of the exact queries users searched for to find your site, which is not available in GA4.
- Identifies critical technical issues: GSC flags crucial problems like mobile usability errors, crawl issues, and security warnings, helping you prioritize fixes.
Cons
- Limited historical data: GSC only keeps data for the last 16 months, so you cannot look at long-term historical trends.
- No conversion data: It focuses on a user’s initial journey from search to your site and does not provide insights into what they do on your site, such as conversions or engaged sessions.
- Narrow scope: GSC is specifically for Google’s search results and provides no data on other search engines like Bing or DuckDuckGo.
SEO Reporting Is Essential to a Comprehensive Growth Marketing Strategy
Hopefully, our guide has turned you into an expert SEO report builder. Having this skill is an important asset, as these reports are a crucial opportunity to draw valuable insights from your website’s performance data.
With the information in these reports, your team can brainstorm, strategize, and plan the next steps to drive organic traffic over time. A well-crafted report will make all the difference in this process.